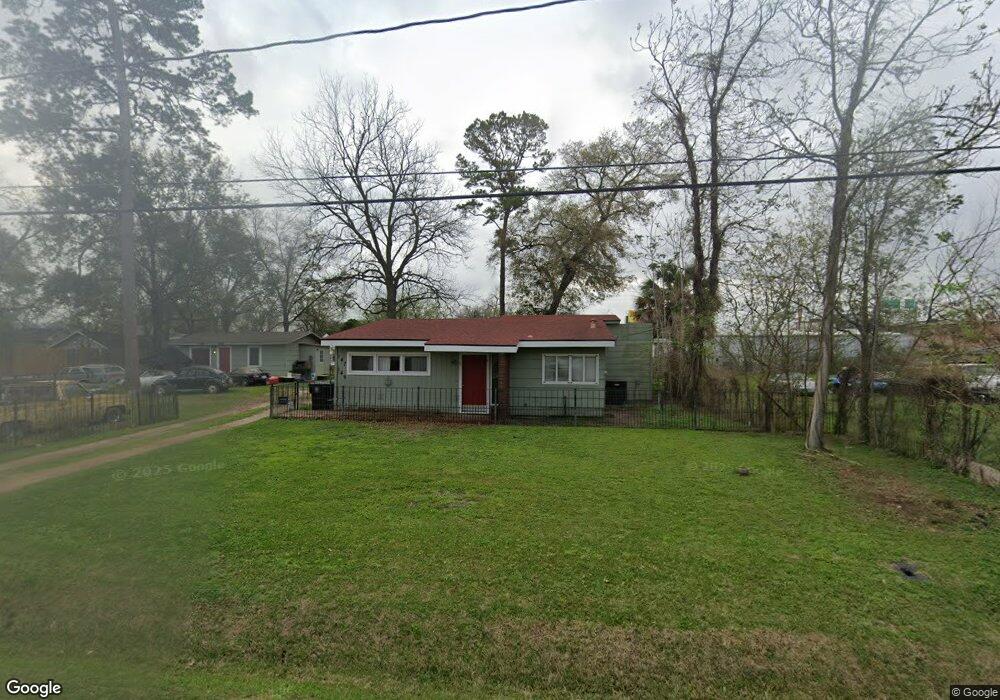
147 Theron St Houston, TX 77022
Northside-Northline NeighborhoodEstimated Value: $261,000 - $476,165
2
Beds
1
Bath
1,617
Sq Ft
$249/Sq Ft
Est. Value
About This Home
This home is located at 147 Theron St, Houston, TX 77022 and is currently estimated at $402,541, approximately $248 per square foot. 147 Theron St is a home located in Harris County with nearby schools including Herrera Elementary School, Burbank Middle School, and Sam Houston Math, Science & Technology Center.
Ownership History
Date
Name
Owned For
Owner Type
Purchase Details
Closed on
Jan 26, 2017
Sold by
Reyes Claudia and Reyes Ramiro
Bought by
Howell Charles Travis
Current Estimated Value
Home Financials for this Owner
Home Financials are based on the most recent Mortgage that was taken out on this home.
Original Mortgage
$256,500
Outstanding Balance
$212,133
Interest Rate
4.16%
Mortgage Type
New Conventional
Estimated Equity
$190,408
Purchase Details
Closed on
Jan 13, 2016
Sold by
Banegas Carlos Alberto and Banegas Christine
Bought by
Reyes Claudia and Reyes Ramiro
Purchase Details
Closed on
Mar 22, 2006
Sold by
Knotts Kelly Shane
Bought by
Banegas Carlos Alberto
Home Financials for this Owner
Home Financials are based on the most recent Mortgage that was taken out on this home.
Original Mortgage
$101,600
Interest Rate
6.21%
Mortgage Type
Fannie Mae Freddie Mac
Create a Home Valuation Report for This Property
The Home Valuation Report is an in-depth analysis detailing your home's value as well as a comparison with similar homes in the area
Home Values in the Area
Average Home Value in this Area
Purchase History
| Date | Buyer | Sale Price | Title Company |
|---|---|---|---|
| Howell Charles Travis | -- | Capital Title | |
| Reyes Claudia | -- | None Available | |
| Banegas Carlos Alberto | -- | Ameripoint Title |
Source: Public Records
Mortgage History
| Date | Status | Borrower | Loan Amount |
|---|---|---|---|
| Open | Howell Charles Travis | $256,500 | |
| Previous Owner | Banegas Carlos Alberto | $101,600 |
Source: Public Records
Tax History Compared to Growth
Tax History
| Year | Tax Paid | Tax Assessment Tax Assessment Total Assessment is a certain percentage of the fair market value that is determined by local assessors to be the total taxable value of land and additions on the property. | Land | Improvement |
|---|---|---|---|---|
| 2025 | $5,169 | $507,000 | $361,335 | $145,665 |
| 2024 | $5,169 | $495,000 | $361,335 | $133,665 |
| 2023 | $5,169 | $355,000 | $313,511 | $41,489 |
| 2022 | $6,552 | $381,421 | $233,805 | $147,616 |
| 2021 | $6,305 | $353,140 | $233,805 | $119,335 |
| 2020 | $5,955 | $342,020 | $233,805 | $108,215 |
| 2019 | $5,657 | $275,000 | $191,295 | $83,705 |
| 2018 | $3,833 | $203,240 | $132,844 | $70,396 |
| 2017 | $5,139 | $203,240 | $132,844 | $70,396 |
| 2016 | $5,139 | $203,240 | $132,844 | $70,396 |
| 2015 | $3,928 | $180,964 | $106,275 | $74,689 |
| 2014 | $3,928 | $152,796 | $74,393 | $78,403 |
Source: Public Records
Map
Nearby Homes
- 136 Theron St
- 65 Neyland St
- 105 Oddo St
- 715 E 34th St
- 0 E 31st St Unit 75519178
- 0 W Hardy St Unit 97848877
- 0 W Hardy St Unit 80694202
- 3111 Eastman St
- 0 Yorkshire St Unit 17401015
- 7014 Finn St
- 210 Van Molan St
- 7018 Finn St
- 1230 Johnston St
- 4402 Airline Dr
- 1228 Johnston St
- 1224 Johnston St
- 1222 Johnston St
- 164 Wallace St
- 1216 Johnston St Unit A/B
- 1224 Neyland St