147 Tyler Ct Fort Worth, TX 76108
Far West Fort Worth NeighborhoodEstimated Value: $763,000 - $1,055,000
4
Beds
3
Baths
2,768
Sq Ft
$351/Sq Ft
Est. Value
About This Home
This home is located at 147 Tyler Ct, Fort Worth, TX 76108 and is currently estimated at $971,158, approximately $350 per square foot. 147 Tyler Ct is a home located in Parker County with nearby schools including Silver Creek Elementary School, Azle Elementary School, and Azle Junior High School.
Ownership History
Date
Name
Owned For
Owner Type
Purchase Details
Closed on
Apr 1, 2009
Sold by
Sharp Patrick J and Sharp Robin D
Bought by
Mills Chad W and Mills Stephen J
Current Estimated Value
Home Financials for this Owner
Home Financials are based on the most recent Mortgage that was taken out on this home.
Original Mortgage
$275,793
Outstanding Balance
$176,209
Interest Rate
5.14%
Mortgage Type
FHA
Estimated Equity
$794,949
Purchase Details
Closed on
Aug 17, 2007
Sold by
Pangle Beth and Pangle Jeffery S
Bought by
Mills Chad W
Home Financials for this Owner
Home Financials are based on the most recent Mortgage that was taken out on this home.
Original Mortgage
$214,000
Interest Rate
5.62%
Mortgage Type
New Conventional
Purchase Details
Closed on
Dec 28, 2001
Sold by
Grimm Shelly
Bought by
Mills Chad W
Purchase Details
Closed on
Sep 8, 2000
Sold by
Canis Major Inc Dba
Bought by
Mills Chad W
Purchase Details
Closed on
Jan 1, 1901
Bought by
Mills Chad W
Create a Home Valuation Report for This Property
The Home Valuation Report is an in-depth analysis detailing your home's value as well as a comparison with similar homes in the area
Home Values in the Area
Average Home Value in this Area
Purchase History
| Date | Buyer | Sale Price | Title Company |
|---|---|---|---|
| Mills Chad W | -- | Natgf | |
| Mills Chad W | -- | -- | |
| Sharp Patrick J | -- | Natc | |
| Mills Chad W | -- | -- | |
| Mills Chad W | -- | -- | |
| Mills Chad W | -- | -- |
Source: Public Records
Mortgage History
| Date | Status | Borrower | Loan Amount |
|---|---|---|---|
| Open | Mills Chad W | $275,793 | |
| Previous Owner | Sharp Patrick J | $214,000 |
Source: Public Records
Tax History Compared to Growth
Tax History
| Year | Tax Paid | Tax Assessment Tax Assessment Total Assessment is a certain percentage of the fair market value that is determined by local assessors to be the total taxable value of land and additions on the property. | Land | Improvement |
|---|---|---|---|---|
| 2025 | $7,733 | $1,230,000 | $102,440 | $1,127,560 |
| 2024 | $7,733 | $1,300,000 | $106,140 | $1,193,860 |
| 2023 | $7,733 | $625,880 | $106,140 | $519,740 |
| 2022 | $7,132 | $385,440 | $76,450 | $308,990 |
| 2021 | $7,473 | $385,440 | $76,450 | $308,990 |
| 2020 | $7,121 | $369,280 | $75,000 | $294,280 |
| 2019 | $7,547 | $369,280 | $75,000 | $294,280 |
| 2018 | $6,648 | $324,270 | $75,000 | $249,270 |
| 2017 | $6,335 | $324,270 | $75,000 | $249,270 |
| 2016 | $6,165 | $315,590 | $75,000 | $240,590 |
| 2015 | $2,276 | $315,590 | $75,000 | $240,590 |
| 2014 | $5,798 | $297,650 | $75,000 | $222,650 |
Source: Public Records
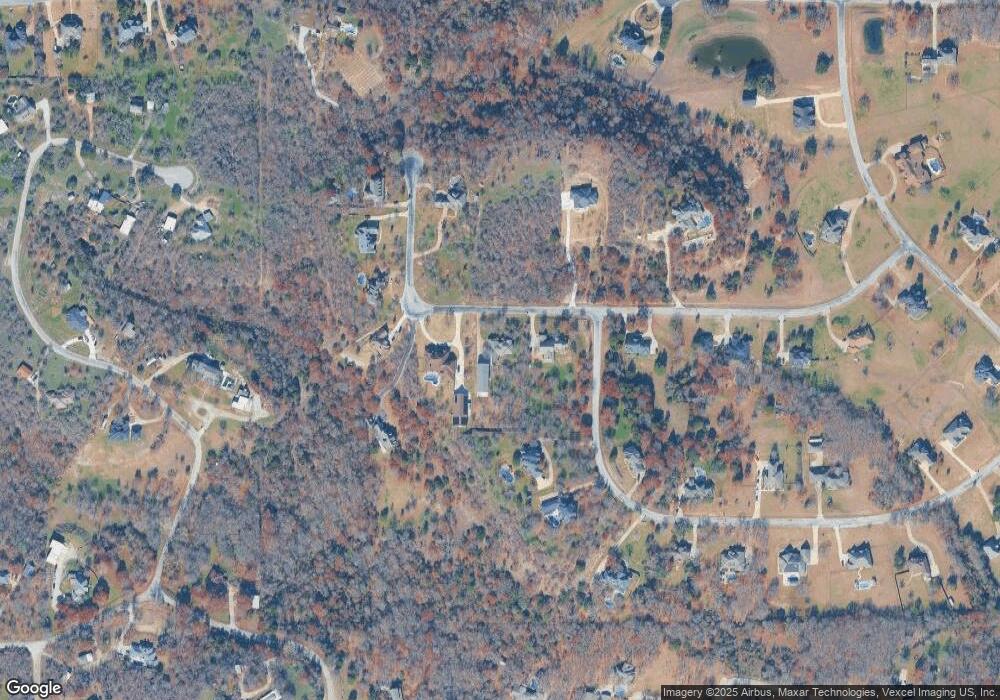
Map
Nearby Homes
- 142 Crown Ridge Ct
- 100 Stone Canyon Cir
- 420 Cattlebaron Parc Dr
- 108 Stone Canyon Cir
- 813 Remuda Dr
- 301 Silver Canyon Dr
- 741 Remuda Dr
- 313 Silver Canyon Dr
- 141 E Bozeman Ln
- 104 Woodview Creek Trail
- 175 N Boyce Ln
- 101 E Bozeman Ln
- 200 W Bozeman Ln
- 332 Tiara Trail
- 328 Tiara Trail
- 694 Boling Ranch Rd
- 109 Arroyo Ct
- 900 Reese Ln
- 742 Boling Ranch Rd
- 1144 Boling Ranch Rd N
- 135 Tyler Ct
- 157 Tyler Ct
- 691 Cattlebaron Parc Dr
- 175 Tyler Ct
- 183 Tyler Ct
- 167 Tyler Ct
- 125 Tyler Ct
- 138 Tyler Ct
- 186 Tyler Ct
- 681 Cattlebaron Parc Dr
- 189 Tyler Ct
- 686 Cattlebaron Parc Dr
- 195 Tyler Ct
- 118 Tyler Ct
- 117 Tyler Ct
- 652 Cattlebaron Parc Dr
- 667 Cattlebaron Parc Dr
- 659 Cattlebaron Parc Dr
- 1108 Colina Dr
- 630 Cattlebaron Parc Dr