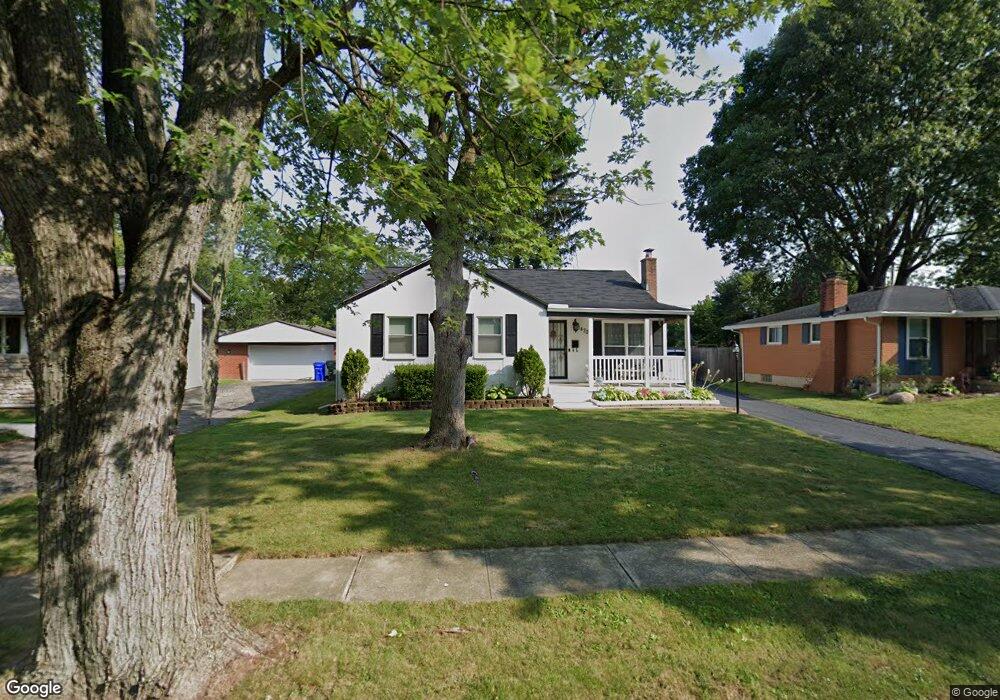
1470 Cardwell Square N Columbus, OH 43229
Devonshire NeighborhoodEstimated Value: $264,000 - $277,000
4
Beds
2
Baths
1,373
Sq Ft
$198/Sq Ft
Est. Value
About This Home
This home is located at 1470 Cardwell Square N, Columbus, OH 43229 and is currently estimated at $271,836, approximately $197 per square foot. 1470 Cardwell Square N is a home located in Franklin County with nearby schools including Devonshire Alternative Elementary School, Woodward Park Middle School, and Beechcroft High School.
Ownership History
Date
Name
Owned For
Owner Type
Purchase Details
Closed on
Nov 16, 2009
Sold by
Velasquez Isagani D and Velasquez Rosalina P
Bought by
Velasquez Jovita P
Current Estimated Value
Home Financials for this Owner
Home Financials are based on the most recent Mortgage that was taken out on this home.
Original Mortgage
$110,736
Outstanding Balance
$72,121
Interest Rate
4.95%
Mortgage Type
FHA
Estimated Equity
$199,715
Purchase Details
Closed on
Aug 30, 2002
Sold by
Collins Michael L
Bought by
Velasquez Jovita P and Velasquez Isagani D
Home Financials for this Owner
Home Financials are based on the most recent Mortgage that was taken out on this home.
Original Mortgage
$121,001
Interest Rate
6.54%
Mortgage Type
FHA
Purchase Details
Closed on
May 14, 1991
Bought by
Collins Michael L
Purchase Details
Closed on
Mar 1, 1988
Create a Home Valuation Report for This Property
The Home Valuation Report is an in-depth analysis detailing your home's value as well as a comparison with similar homes in the area
Home Values in the Area
Average Home Value in this Area
Purchase History
| Date | Buyer | Sale Price | Title Company |
|---|---|---|---|
| Velasquez Jovita P | -- | Polaris Tit | |
| Velasquez Jovita P | $122,900 | Chicago Title | |
| Collins Michael L | $79,900 | -- | |
| -- | -- | -- |
Source: Public Records
Mortgage History
| Date | Status | Borrower | Loan Amount |
|---|---|---|---|
| Open | Velasquez Jovita P | $110,736 | |
| Closed | Velasquez Jovita P | $121,001 |
Source: Public Records
Tax History Compared to Growth
Tax History
| Year | Tax Paid | Tax Assessment Tax Assessment Total Assessment is a certain percentage of the fair market value that is determined by local assessors to be the total taxable value of land and additions on the property. | Land | Improvement |
|---|---|---|---|---|
| 2024 | $3,666 | $81,690 | $17,500 | $64,190 |
| 2023 | $3,619 | $81,690 | $17,500 | $64,190 |
| 2022 | $2,672 | $51,520 | $12,600 | $38,920 |
| 2021 | $2,677 | $51,520 | $12,600 | $38,920 |
| 2020 | $2,680 | $51,520 | $12,600 | $38,920 |
| 2019 | $2,484 | $40,950 | $10,080 | $30,870 |
| 2018 | $2,236 | $40,950 | $10,080 | $30,870 |
| 2017 | $2,483 | $40,950 | $10,080 | $30,870 |
| 2016 | $2,196 | $33,150 | $7,670 | $25,480 |
| 2015 | $1,993 | $33,150 | $7,670 | $25,480 |
| 2014 | $1,998 | $33,150 | $7,670 | $25,480 |
| 2013 | $1,095 | $36,820 | $8,505 | $28,315 |
Source: Public Records
Map
Nearby Homes
- 6407 Faircrest Rd
- 1421 Bosworth Place
- 1409 Bosworth Place
- 6458 Faircrest Rd
- 1268 Kildale Ct
- 6342 Bellmeadow Dr
- 1294 Clydesdale Ct
- 1635 Tendril Ct
- 1322 Bolenhill Ct
- 1549 Alpine Dr
- 6407 Skywae Dr
- 1288 Oakfield Dr N
- 6189 Northgap Dr
- 6035 Karl Rd
- 1755 Hillandale Ave
- 6211 Parkdale Dr
- 6355 Johnanne St
- 6245 Sharon Woods Blvd
- 6496 Hearthstone Ave
- 5990 Ambleside Dr
- 1462 Cardwell Square N
- 1478 Cardwell Square N
- 1454 Cardwell Square N
- 1471 Cranwood Dr
- 1477 Cranwood Dr
- 1465 Cranwood Dr
- 1484 Cardwell Square N
- 1483 Cranwood Dr
- 1457 Cranwood Dr
- 1465 Cardwell Square N
- 1446 Cardwell Square N
- 6433 Cardwell Square E
- 1457 Cardwell Square N
- 6440 Cardwell Square E
- 1445 Cranwood Dr
- 1491 Cranwood Dr
- 1449 Cardwell Square N
- 1438 Cardwell Square N
- 6434 Cardwell Square E
- 1439 Cranwood Dr