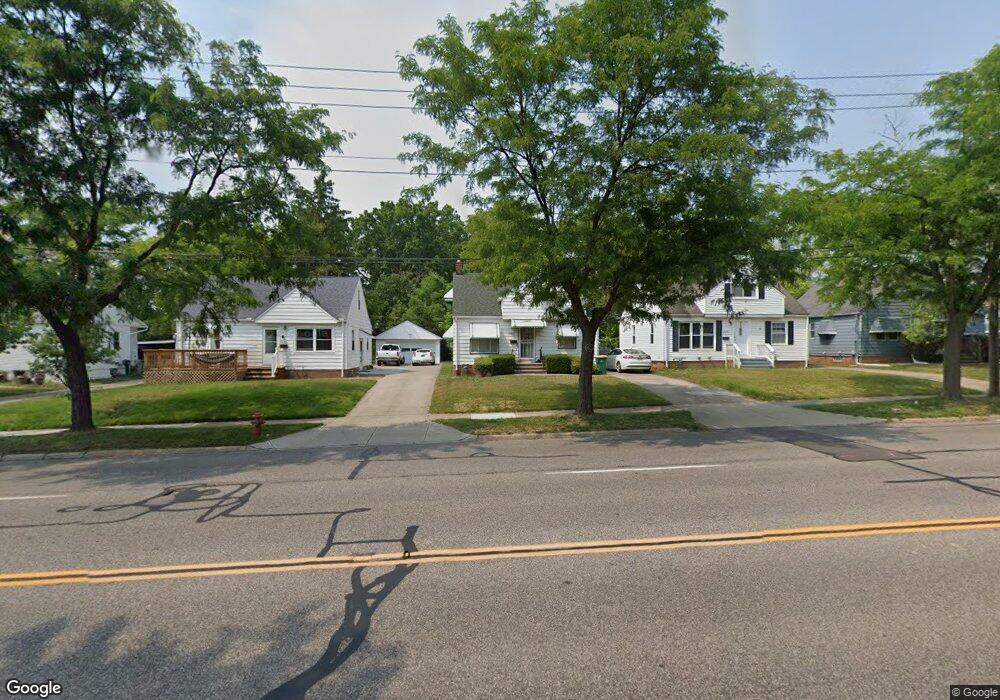
14705 Rockside Rd Maple Heights, OH 44137
Estimated Value: $115,974 - $130,000
2
Beds
1
Bath
1,080
Sq Ft
$112/Sq Ft
Est. Value
About This Home
This home is located at 14705 Rockside Rd, Maple Heights, OH 44137 and is currently estimated at $121,494, approximately $112 per square foot. 14705 Rockside Rd is a home located in Cuyahoga County with nearby schools including Abraham Lincoln Elementary School, Rockside/ J.F. Kennedy School, and Barack Obama School.
Ownership History
Date
Name
Owned For
Owner Type
Purchase Details
Closed on
Feb 14, 1984
Sold by
Jindra James P and Jindra Mary E
Bought by
Jindra Mary E
Current Estimated Value
Purchase Details
Closed on
Jan 1, 1975
Bought by
Jindra James P and Jindra Mary E
Create a Home Valuation Report for This Property
The Home Valuation Report is an in-depth analysis detailing your home's value as well as a comparison with similar homes in the area
Home Values in the Area
Average Home Value in this Area
Purchase History
| Date | Buyer | Sale Price | Title Company |
|---|---|---|---|
| Jindra Mary E | -- | -- | |
| Jindra James P | -- | -- |
Source: Public Records
Tax History
| Year | Tax Paid | Tax Assessment Tax Assessment Total Assessment is a certain percentage of the fair market value that is determined by local assessors to be the total taxable value of land and additions on the property. | Land | Improvement |
|---|---|---|---|---|
| 2025 | $2,914 | $35,000 | $5,950 | $29,050 |
| 2024 | $3,238 | $35,000 | $5,950 | $29,050 |
| 2023 | $2,347 | $21,360 | $4,940 | $16,420 |
| 2022 | $2,339 | $21,350 | $4,940 | $16,420 |
| 2021 | $2,494 | $21,350 | $4,940 | $16,420 |
| 2020 | $2,132 | $16,170 | $3,750 | $12,430 |
| 2019 | $2,007 | $46,200 | $10,700 | $35,500 |
| 2018 | $2,110 | $16,170 | $3,750 | $12,430 |
| 2017 | $2,060 | $15,370 | $3,080 | $12,290 |
| 2016 | $1,993 | $15,370 | $3,080 | $12,290 |
| 2015 | $1,889 | $15,370 | $3,080 | $12,290 |
| 2014 | $1,889 | $15,860 | $3,190 | $12,670 |
Source: Public Records
Map
Nearby Homes
- 14808 James Ave
- 14320 Janice Dr
- 14012 Wheeler Rd
- 14214 Tabor Ave
- 5948 Dunham Rd
- 14203 Tabor Ave
- 13804 Rockside Rd
- 14413 Krems Ave
- 5853 Monica Ln
- 14112 Krems Ave
- 13905 Thraves Ave
- 15800 Northwood Ave
- 13810 Martin Dr
- 13800 Milo Rd
- 6045 Dunham Rd
- 15313 Fernway Dr
- 15817 Northwood Ave
- 14956 Carol Dr
- 13741 Grove Dr
- 6089 Dunham Rd
- 14709 Rockside Rd
- 14713 Rockside Rd
- 14609 Rockside Rd
- 14721 Rockside Rd
- 14601 Rockside Rd
- 5745 E 146th St
- 5741 E 146th St
- 14801 Rockside Rd
- 14704 Rockside Rd
- 14708 Rockside Rd
- 14551 Rockside Rd
- 14616 Rockside Rd
- 5749 E 146th St
- 14612 Rockside Rd
- 14805 Rockside Rd
- 14716 Rockside Rd
- 5737 E 146th St
- 14519 Rockside Rd
- 14809 Rockside Rd
Your Personal Tour Guide
Ask me questions while you tour the home.