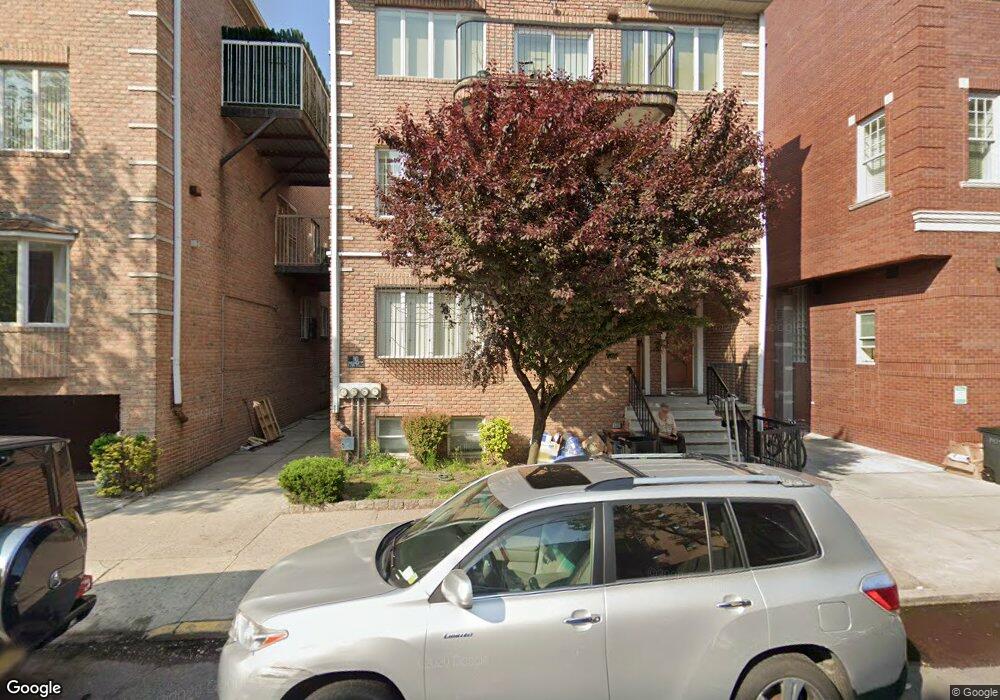
1471 53rd St Unit 3 Brooklyn, NY 11219
Borough Park NeighborhoodEstimated Value: $1,127,000 - $1,761,503
Studio
--
Bath
2,026
Sq Ft
$767/Sq Ft
Est. Value
About This Home
This home is located at 1471 53rd St Unit 3, Brooklyn, NY 11219 and is currently estimated at $1,554,626, approximately $767 per square foot. 1471 53rd St Unit 3 is a home located in Kings County with nearby schools including The Seeall Academy, I.S. 223 The Montauk, and Franklin Delano Roosevelt High School.
Ownership History
Date
Name
Owned For
Owner Type
Purchase Details
Closed on
Mar 15, 2024
Sold by
Geller Yecheskel Eliezer
Bought by
1471 53 St Holdings Llc
Current Estimated Value
Purchase Details
Closed on
Jul 31, 2023
Sold by
Harry Greenwald Trustee and Mg 12-21 Family Trust
Bought by
Geller Yecheskel Eliezer
Home Financials for this Owner
Home Financials are based on the most recent Mortgage that was taken out on this home.
Original Mortgage
$1,050,000
Interest Rate
6.71%
Mortgage Type
Purchase Money Mortgage
Purchase Details
Closed on
Dec 28, 2021
Sold by
Grunwald Mariana
Bought by
Harry Greenwald As Trustee and Mg 12-21 Family Trust
Purchase Details
Closed on
Mar 3, 2020
Sold by
Rosingman Corporation
Bought by
Grunwald Mariana
Create a Home Valuation Report for This Property
The Home Valuation Report is an in-depth analysis detailing your home's value as well as a comparison with similar homes in the area
Home Values in the Area
Average Home Value in this Area
Purchase History
| Date | Buyer | Sale Price | Title Company |
|---|---|---|---|
| 1471 53 St Holdings Llc | -- | -- | |
| 1471 53 St Holdings Llc | -- | -- | |
| Geller Yecheskel Eliezer | $1,625,000 | -- | |
| Geller Yecheskel Eliezer | $1,625,000 | -- | |
| Geller Yecheskel Eliezer | $1,625,000 | -- | |
| Harry Greenwald As Trustee | -- | -- | |
| Harry Greenwald As Trustee | -- | -- | |
| Harry Greenwald As Trustee | -- | -- | |
| Grunwald Mariana | -- | -- | |
| Grunwald Mariana | -- | -- | |
| Grunwald Mariana | -- | -- |
Source: Public Records
Mortgage History
| Date | Status | Borrower | Loan Amount |
|---|---|---|---|
| Previous Owner | Geller Yecheskel Eliezer | $1,050,000 |
Source: Public Records
Tax History
| Year | Tax Paid | Tax Assessment Tax Assessment Total Assessment is a certain percentage of the fair market value that is determined by local assessors to be the total taxable value of land and additions on the property. | Land | Improvement |
|---|---|---|---|---|
| 2025 | $8,502 | $72,120 | $4,880 | $67,240 |
| 2024 | $8,502 | $62,900 | $4,880 | $58,020 |
| 2023 | $8,597 | $69,920 | $4,880 | $65,040 |
| 2022 | $8,367 | $64,460 | $4,880 | $59,580 |
| 2021 | $8,322 | $60,400 | $4,880 | $55,520 |
| 2019 | $7,379 | $41,761 | $4,880 | $36,881 |
| 2018 | $7,191 | $35,275 | $4,438 | $30,837 |
| 2017 | $7,120 | $34,928 | $4,742 | $30,186 |
| 2016 | $6,587 | $32,952 | $4,853 | $28,099 |
| 2015 | $3,974 | $31,159 | $4,857 | $26,302 |
| 2014 | $3,974 | $29,396 | $4,880 | $24,516 |
Source: Public Records
Map
Nearby Homes
- 5602 New Utrecht Ave
- 1692 52nd St
- 5812 New Utrecht Ave
- 1323 46th St Unit 5C
- 1768 55th St
- 1241 60th St
- 1772 55th St
- 1230 59th St
- 4824 New Utrecht Ave
- 4709 New Utrecht Ave
- 4726 New Utrecht Ave
- 1348 63rd St Unit 5
- 1363 64th St
- 1240 43rd St
- 6311 13th Ave
- 1315 64th St
- 6426 New Utrecht Ave
- 1545 65th St
- 6420 16th Ave
- 1238 63rd St Unit 438
- 1471 53rd St Unit 2
- 1471 53rd St Unit 1
- 1471 53rd St
- 1467 53rd St Unit 1
- 1467 53rd St Unit 3
- 1467 53rd St Unit 2
- 1467 53rd St
- 5224 15th Ave
- 1461 53rd St
- 5214 15th Ave Unit 5B
- 5214 15th Ave Unit 5A
- 5214 15th Ave Unit 6B
- 5214 15th Ave Unit 2B
- 5214 15th Ave Unit 1A
- 5214 15th Ave Unit 6A
- 5214 15th Ave Unit 4B
- 5214 15th Ave Unit 3A
- 5214 15th Ave Unit 2A
- 5214 15th Ave Unit 4A
- 5214 15th Ave
Your Personal Tour Guide
Ask me questions while you tour the home.