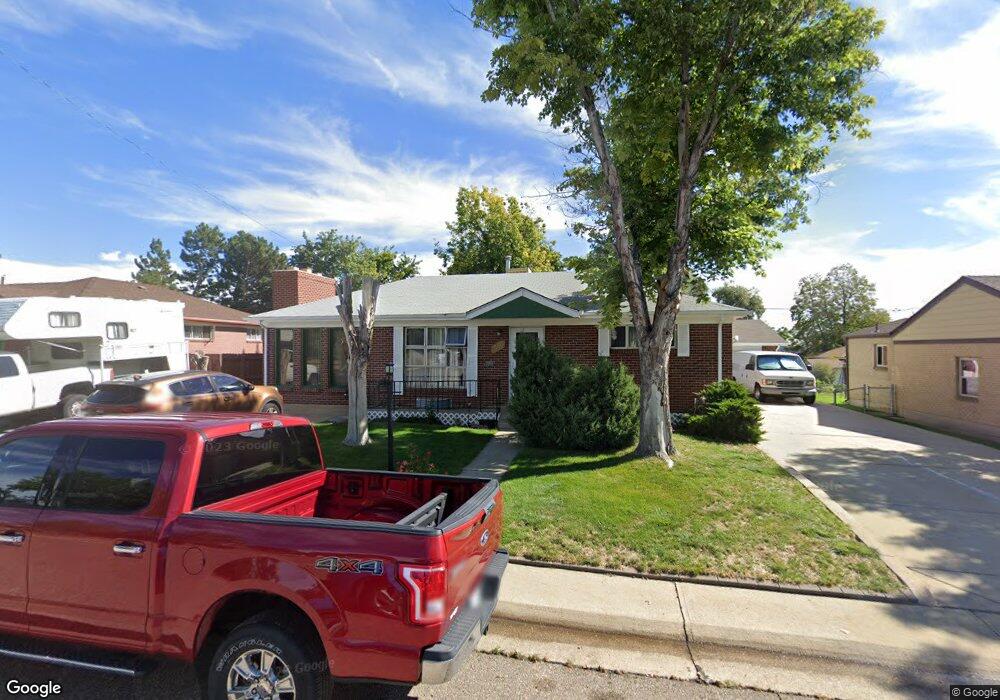
1471 Coring Place Northglenn, CO 80233
Estimated Value: $453,000 - $480,000
3
Beds
2
Baths
1,125
Sq Ft
$415/Sq Ft
Est. Value
About This Home
This home is located at 1471 Coring Place, Northglenn, CO 80233 and is currently estimated at $466,496, approximately $414 per square foot. 1471 Coring Place is a home located in Adams County with nearby schools including Woodglen Elementary School, Leroy Drive Elementary School, and Northglenn Middle School.
Ownership History
Date
Name
Owned For
Owner Type
Purchase Details
Closed on
Aug 13, 2002
Sold by
Lippoldt Roy S and Lippoldt Laverne J
Bought by
Lippoldt Roy S
Current Estimated Value
Home Financials for this Owner
Home Financials are based on the most recent Mortgage that was taken out on this home.
Original Mortgage
$158,250
Outstanding Balance
$66,580
Interest Rate
6.47%
Estimated Equity
$399,916
Purchase Details
Closed on
Jul 24, 2001
Sold by
Chase Jeffrey J and Chase Paula L
Bought by
Lippoldt Roy S and Lippoldt Laverne J
Home Financials for this Owner
Home Financials are based on the most recent Mortgage that was taken out on this home.
Original Mortgage
$141,200
Interest Rate
7.07%
Purchase Details
Closed on
Sep 28, 1999
Sold by
Montoya Virginia O
Bought by
Chase Jeffrey J and Chase Paula L
Home Financials for this Owner
Home Financials are based on the most recent Mortgage that was taken out on this home.
Original Mortgage
$120,120
Interest Rate
8.02%
Create a Home Valuation Report for This Property
The Home Valuation Report is an in-depth analysis detailing your home's value as well as a comparison with similar homes in the area
Home Values in the Area
Average Home Value in this Area
Purchase History
| Date | Buyer | Sale Price | Title Company |
|---|---|---|---|
| Lippoldt Roy S | -- | First American Heritage Titl | |
| Lippoldt Roy S | $176,500 | Land Title Guarantee Company | |
| Chase Jeffrey J | $149,900 | -- |
Source: Public Records
Mortgage History
| Date | Status | Borrower | Loan Amount |
|---|---|---|---|
| Open | Lippoldt Roy S | $158,250 | |
| Closed | Lippoldt Roy S | $141,200 | |
| Previous Owner | Chase Jeffrey J | $120,120 | |
| Closed | Chase Jeffrey J | $22,660 |
Source: Public Records
Tax History Compared to Growth
Tax History
| Year | Tax Paid | Tax Assessment Tax Assessment Total Assessment is a certain percentage of the fair market value that is determined by local assessors to be the total taxable value of land and additions on the property. | Land | Improvement |
|---|---|---|---|---|
| 2024 | $3,450 | $28,500 | $5,750 | $22,750 |
| 2023 | $3,418 | $32,600 | $5,610 | $26,990 |
| 2022 | $3,184 | $25,210 | $5,770 | $19,440 |
| 2021 | $3,286 | $25,210 | $5,770 | $19,440 |
| 2020 | $3,002 | $23,500 | $5,930 | $17,570 |
| 2019 | $3,004 | $23,500 | $5,930 | $17,570 |
| 2018 | $2,525 | $19,250 | $5,400 | $13,850 |
| 2017 | $2,324 | $19,250 | $5,400 | $13,850 |
| 2016 | $2,050 | $16,580 | $3,020 | $13,560 |
| 2015 | $2,046 | $16,580 | $3,020 | $13,560 |
| 2014 | -- | $14,340 | $2,390 | $11,950 |
Source: Public Records
Map
Nearby Homes
- 10761 Rosalie Dr
- 10674 Downing St
- 1102 Leroy Dr
- 10440 Gilpin St
- 10429 Lafayette St
- 925 E 108th Ave
- 1462 E 110th Place
- 1324 Lucille Ct
- 10966 Alvin Dr
- 11009 Gaylord St
- 11045 Gaylord St
- 11062 Gaylord St
- 10752 Blue Jay Ln
- 10966 Josephine St
- 2085 E 103rd Ave
- 10448 Pearl Way
- 11112 Claude Ct
- 11149 Gaylord St
- 2969 E 103rd Dr
- 2751 E 102nd Place
- 1501 Coring Place
- 1461 Coring Place
- 10721 Rosalie Dr
- 1451 Coring Place
- 1511 Coring Place
- 10711 Rosalie Dr
- 10782 Loren Ln
- 10741 Rosalie Dr
- 1440 Coring Place
- 10701 Rosalie Dr
- 10751 Rosalie Dr
- 1521 Coring Place
- 1441 Coring Place
- 1420 Coring Place
- 10772 Loren Ln
- 10730 Rosalie Dr
- 10720 Rosalie Dr
- 10740 Rosalie Dr
- 10691 Rosalie Dr
- 10710 Rosalie Dr