Estimated Value: $167,000 - $185,000
3
Beds
2
Baths
962
Sq Ft
$186/Sq Ft
Est. Value
About This Home
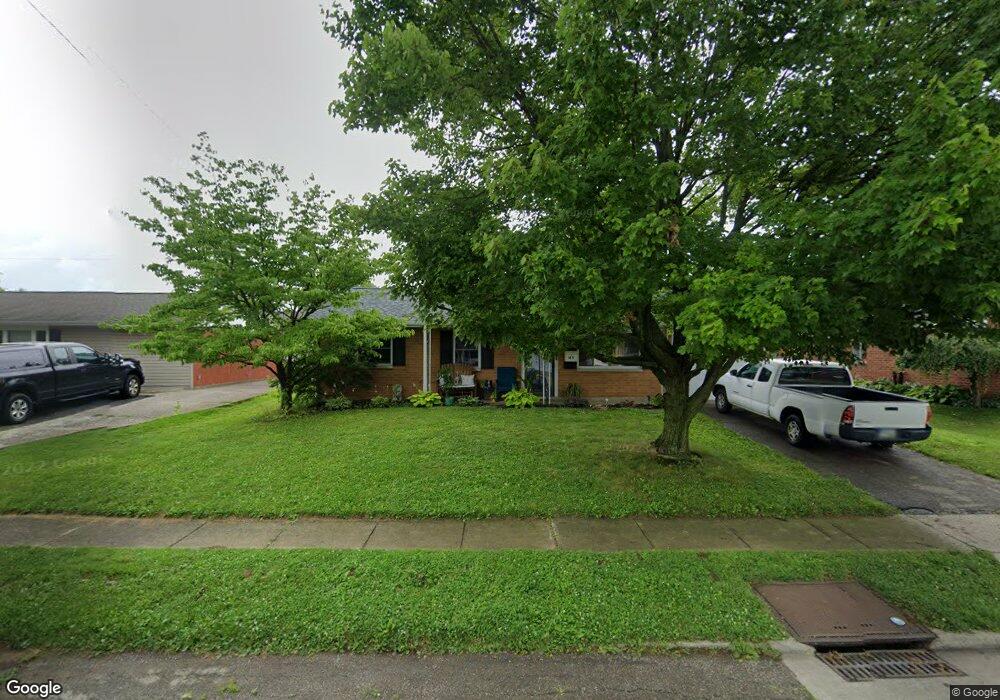
This home is located at 1471 Ottawa Dr, Xenia, OH 45385 and is currently estimated at $178,839, approximately $185 per square foot. 1471 Ottawa Dr is a home located in Greene County with nearby schools including Xenia High School, Summit Academy Community School for Alternative Learners - Xenia, and Legacy Christian Academy.
Ownership History
Date
Name
Owned For
Owner Type
Purchase Details
Closed on
Jul 6, 2020
Sold by
Butcher Zane A and Butcher Brenda G
Bought by
Taylor Devon R
Current Estimated Value
Home Financials for this Owner
Home Financials are based on the most recent Mortgage that was taken out on this home.
Original Mortgage
$96,224
Outstanding Balance
$85,483
Interest Rate
3.2%
Mortgage Type
FHA
Estimated Equity
$93,356
Purchase Details
Closed on
Jun 30, 2016
Sold by
Rosalie A Mcclelland
Bought by
Butcher Zane and Butcher Brenda
Home Financials for this Owner
Home Financials are based on the most recent Mortgage that was taken out on this home.
Original Mortgage
$38,000
Interest Rate
3.48%
Purchase Details
Closed on
May 16, 2016
Bought by
Butcher Zane A
Home Financials for this Owner
Home Financials are based on the most recent Mortgage that was taken out on this home.
Original Mortgage
$38,000
Interest Rate
3.48%
Create a Home Valuation Report for This Property
The Home Valuation Report is an in-depth analysis detailing your home's value as well as a comparison with similar homes in the area
Home Values in the Area
Average Home Value in this Area
Purchase History
| Date | Buyer | Sale Price | Title Company |
|---|---|---|---|
| Taylor Devon R | $98,000 | Chicago Title Company Llc | |
| Butcher Zane | -- | -- | |
| Butcher Zane A | $46,000 | -- |
Source: Public Records
Mortgage History
| Date | Status | Borrower | Loan Amount |
|---|---|---|---|
| Open | Taylor Devon R | $96,224 | |
| Previous Owner | Butcher Zane A | $38,000 | |
| Previous Owner | Butcher Zane A | -- | |
| Previous Owner | Butcher Zane A | -- |
Source: Public Records
Tax History Compared to Growth
Tax History
| Year | Tax Paid | Tax Assessment Tax Assessment Total Assessment is a certain percentage of the fair market value that is determined by local assessors to be the total taxable value of land and additions on the property. | Land | Improvement |
|---|---|---|---|---|
| 2024 | $1,906 | $44,550 | $11,140 | $33,410 |
| 2023 | $1,906 | $44,550 | $11,140 | $33,410 |
| 2022 | $1,581 | $31,510 | $6,550 | $24,960 |
| 2021 | $1,602 | $31,510 | $6,550 | $24,960 |
| 2020 | $1,535 | $31,510 | $6,550 | $24,960 |
| 2019 | $1,329 | $25,680 | $6,370 | $19,310 |
| 2018 | $1,334 | $25,680 | $6,370 | $19,310 |
| 2017 | $1,296 | $25,680 | $6,370 | $19,310 |
| 2016 | $744 | $23,190 | $6,370 | $16,820 |
| 2015 | $746 | $23,190 | $6,370 | $16,820 |
| 2014 | $714 | $23,190 | $6,370 | $16,820 |
Source: Public Records
Map
Nearby Homes
- 1568 Cheyenne Dr
- 1618 Navajo Dr
- 1653 Seneca Dr
- 1144 Rockwell Dr
- 1778 Arapaho Dr
- 2758 Wyoming Dr
- 161 Montana Dr
- 1769 Gayhart Dr
- 121 S Progress Dr
- 1208 Bellbrook Ave
- 1272 Bellbrook Ave
- 1342 Kylemore Dr
- 1829 Gayhart Dr
- 219 Kansas Dr
- 1391 June Dr
- 1283 June Dr
- 414 Whisper Ln
- 1233 June Dr
- 2142 Michigan Dr
- 1223 June Dr
- 1491 Ottawa Dr
- 1457 Ottawa Dr
- 1454 Navajo Dr
- 1441 Ottawa Dr
- 1440 Navajo Dr
- 1468 Navajo Dr
- 1503 Ottawa Dr
- 1460 Ottawa Dr
- 1426 Navajo Dr
- 1472 Ottawa Dr
- 1480 Navajo Dr
- 1446 Ottawa Dr
- 1486 Ottawa Dr
- 1487 Seminole Dr
- 1432 Ottawa Dr
- 1412 Navajo Dr
- 1420 Ottawa Dr
- 1535 Ottawa Dr
- 1457 Oshaughnesy Dr
- 1471 Oshaughnesy Dr