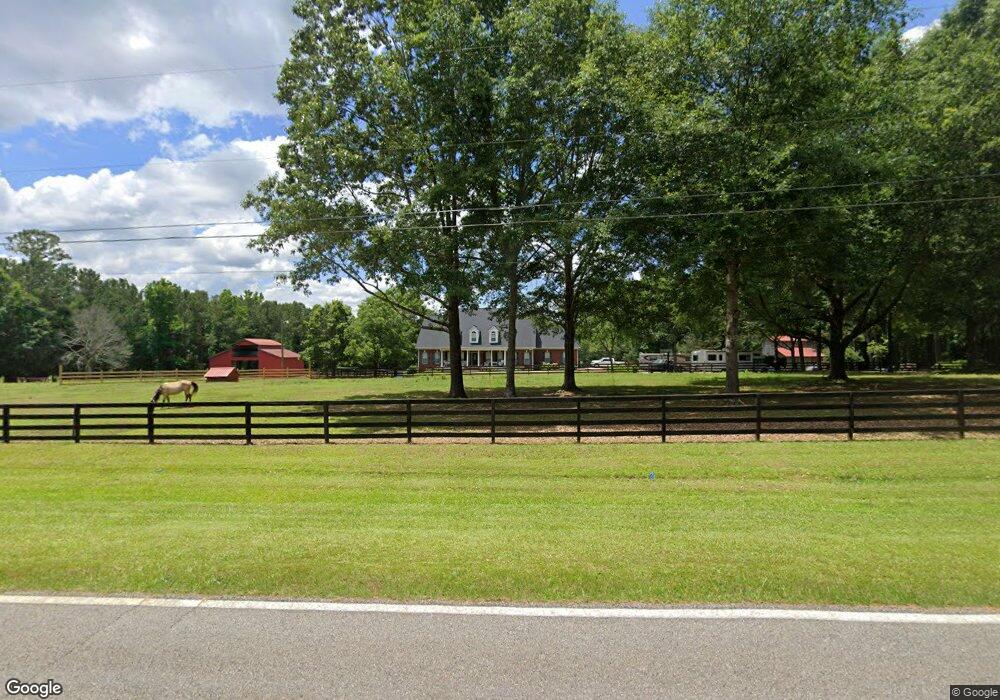
1471 Sugar Creek Church Rd Unit 358/4 Madison, GA 30650
Buckhead Morgan NeighborhoodEstimated Value: $832,000 - $964,000
4
Beds
4
Baths
3,696
Sq Ft
$239/Sq Ft
Est. Value
About This Home
This home is located at 1471 Sugar Creek Church Rd Unit 358/4, Madison, GA 30650 and is currently estimated at $883,236, approximately $238 per square foot. 1471 Sugar Creek Church Rd Unit 358/4 is a home located in Morgan County with nearby schools including Morgan County Primary School, Morgan County Elementary School, and Morgan County Middle School.
Ownership History
Date
Name
Owned For
Owner Type
Purchase Details
Closed on
Nov 28, 2017
Sold by
Cawley Anne
Bought by
Foster Robert L
Current Estimated Value
Home Financials for this Owner
Home Financials are based on the most recent Mortgage that was taken out on this home.
Original Mortgage
$437,992
Outstanding Balance
$367,886
Interest Rate
3.94%
Mortgage Type
VA
Estimated Equity
$515,350
Purchase Details
Closed on
Apr 3, 2015
Sold by
Curry Charles C
Bought by
Cawley Anne
Purchase Details
Closed on
Sep 8, 2014
Sold by
Curry Charles C
Bought by
Curry Charles C
Purchase Details
Closed on
Jul 19, 2010
Sold by
Curry Charles C
Bought by
Curry Charles C and Curry Angela W
Purchase Details
Closed on
Apr 5, 2004
Sold by
Curry Charles C and Curry Ka
Bought by
Curry Charles C
Purchase Details
Closed on
Apr 20, 1998
Sold by
Lemonds Lemonds and Lemonds Herndon
Bought by
Curry Charles C and Curry Ka
Create a Home Valuation Report for This Property
The Home Valuation Report is an in-depth analysis detailing your home's value as well as a comparison with similar homes in the area
Home Values in the Area
Average Home Value in this Area
Purchase History
| Date | Buyer | Sale Price | Title Company |
|---|---|---|---|
| Foster Robert L | $424,000 | -- | |
| Cawley Anne | $345,000 | -- | |
| Curry Charles C | -- | -- | |
| Curry Charles C | -- | -- | |
| Curry Charles C | -- | -- | |
| Curry Charles C | $71,600 | -- |
Source: Public Records
Mortgage History
| Date | Status | Borrower | Loan Amount |
|---|---|---|---|
| Open | Foster Robert L | $437,992 |
Source: Public Records
Tax History Compared to Growth
Tax History
| Year | Tax Paid | Tax Assessment Tax Assessment Total Assessment is a certain percentage of the fair market value that is determined by local assessors to be the total taxable value of land and additions on the property. | Land | Improvement |
|---|---|---|---|---|
| 2025 | $5,113 | $261,655 | $49,613 | $212,042 |
| 2024 | $5,167 | $228,769 | $44,100 | $184,669 |
| 2023 | $4,819 | $207,063 | $37,839 | $169,224 |
| 2022 | $4,285 | $177,185 | $17,076 | $160,109 |
| 2021 | $4,303 | $177,185 | $17,076 | $160,109 |
| 2020 | $4,343 | $177,185 | $17,076 | $160,109 |
| 2019 | $4,464 | $177,185 | $17,076 | $160,109 |
| 2018 | $4,337 | $175,787 | $15,678 | $160,109 |
| 2017 | $3,947 | $152,370 | $15,678 | $136,692 |
| 2016 | $3,598 | $141,992 | $15,523 | $126,469 |
| 2015 | $3,645 | $138,040 | $13,840 | $124,200 |
| 2014 | $3,797 | $147,680 | $43,000 | $104,680 |
| 2013 | -- | $119,360 | $43,880 | $75,480 |
Source: Public Records
Map
Nearby Homes
- 1751 Apalachee River Rd
- 1050 Sugar Creek Church Rd
- 1031 Whispering Lakes Trail
- 1051 Meadow Ln
- 1040 River Woods Dr
- 1220 Waterstone Dr
- 0 Cleveland Ave Unit 10495992
- 1061 Apalachee Shores Ct
- 1051 Apalachee Shores Ct
- 1041 Apalachee Shores Ct
- 1080 Cleveland Ave
- 1501 Meadow Ln
- 1170 River Woods Dr
- 1061 Shoreline Dr
- 0 Oconee Rd Lot 6
- 0 Oconee Rd Lot 7
- 0 Oconee Rd Lot 5
- 0 Oconee Rd Lot 4
- 1400 Heidi Trail
- 1597 Oconee Rd
- 1471 Sugar Creek Church Rd
- 1441 Sugar Creek Church Rd
- 0 Sugar Creek Church Rd Unit 8.19 Ac 8484686
- 0 Sugar Creek Church Rd Unit 7289816
- 1411 Sugar Creek Church Rd
- 1581 Sugar Creek Church Rd
- 1391 Sugar Creek Church Rd
- 1580 Sugar Creek Church Rd
- 1590 Sugar Creek Church Rd Unit 3
- 1590 Sugar Creek Church Rd
- 1561 Sugar Creek Church Rd
- 1630 Sugar Creek Church Rd
- 1290 Sugar Creek Church Rd
- 1665 Sugar Creek Church Rd
- 1231 Sugar Creek Church Rd
- 1000 Guinn Rd
- 1221 Sugar Creek Church Rd
- 1121 Guinn Rd
- 0 Guinn Rd Unit 3189389
- 1040 Guinn Rd