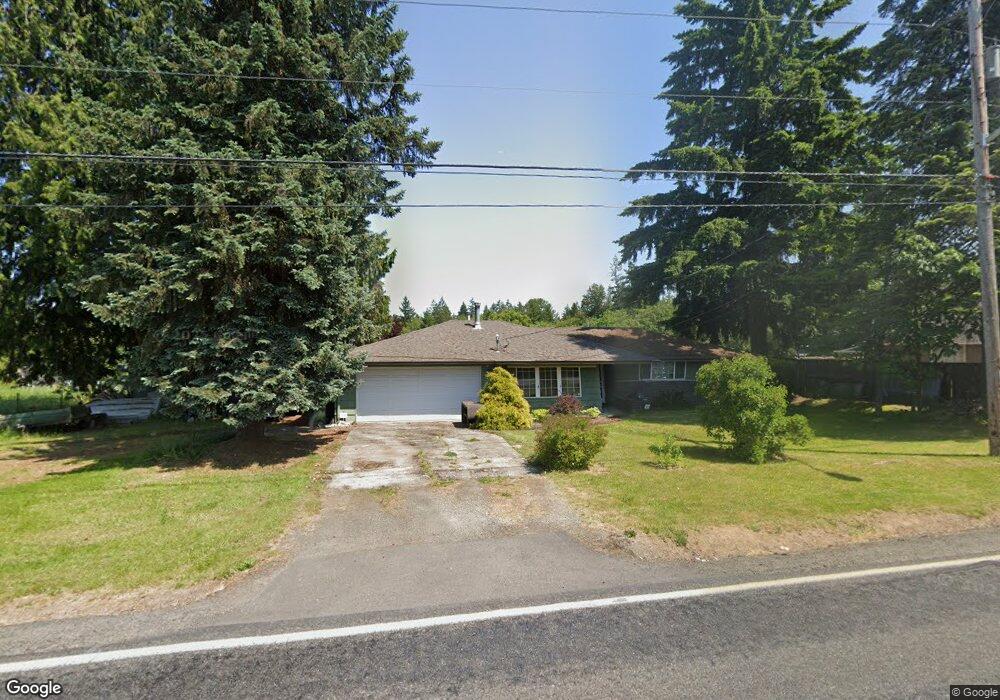
14711 86th Ave E Puyallup, WA 98375
Estimated Value: $549,000 - $684,000
3
Beds
2
Baths
1,080
Sq Ft
$559/Sq Ft
Est. Value
About This Home
This home is located at 14711 86th Ave E, Puyallup, WA 98375 and is currently estimated at $603,305, approximately $558 per square foot. 14711 86th Ave E is a home located in Pierce County with nearby schools including Firgrove Elementary School, Ballou Junior High School, and Gov. John Rogers High School.
Ownership History
Date
Name
Owned For
Owner Type
Purchase Details
Closed on
May 22, 2012
Sold by
Callaway Joseph and Callaway Brenda Lee
Bought by
Callaway Joseph and Callaway Brenda Lee
Current Estimated Value
Home Financials for this Owner
Home Financials are based on the most recent Mortgage that was taken out on this home.
Original Mortgage
$309,734
Outstanding Balance
$212,880
Interest Rate
3.73%
Mortgage Type
FHA
Estimated Equity
$390,425
Purchase Details
Closed on
Dec 7, 2009
Sold by
Callaway Joseph and Callaway Brenda L
Bought by
Callaway Joseph
Home Financials for this Owner
Home Financials are based on the most recent Mortgage that was taken out on this home.
Original Mortgage
$316,320
Interest Rate
4.88%
Mortgage Type
FHA
Purchase Details
Closed on
Jul 17, 2006
Sold by
Criss Steven G and Criss Mary Ann
Bought by
Callaway Joseph
Home Financials for this Owner
Home Financials are based on the most recent Mortgage that was taken out on this home.
Original Mortgage
$38,500
Interest Rate
6.57%
Mortgage Type
Stand Alone Second
Create a Home Valuation Report for This Property
The Home Valuation Report is an in-depth analysis detailing your home's value as well as a comparison with similar homes in the area
Home Values in the Area
Average Home Value in this Area
Purchase History
| Date | Buyer | Sale Price | Title Company |
|---|---|---|---|
| Callaway Joseph | -- | Lsi | |
| Callaway Joseph | -- | Landsel Title | |
| Callaway Joseph | $385,000 | Fidelity National Title Insu |
Source: Public Records
Mortgage History
| Date | Status | Borrower | Loan Amount |
|---|---|---|---|
| Open | Callaway Joseph | $309,734 | |
| Closed | Callaway Joseph | $316,320 | |
| Closed | Callaway Joseph | $38,500 | |
| Closed | Callaway Joseph | $308,000 |
Source: Public Records
Tax History Compared to Growth
Tax History
| Year | Tax Paid | Tax Assessment Tax Assessment Total Assessment is a certain percentage of the fair market value that is determined by local assessors to be the total taxable value of land and additions on the property. | Land | Improvement |
|---|---|---|---|---|
| 2025 | $5,469 | $541,800 | $336,100 | $205,700 |
| 2024 | $5,469 | $537,700 | $328,600 | $209,100 |
| 2023 | $5,469 | $528,600 | $328,600 | $200,000 |
| 2022 | $5,513 | $563,400 | $368,400 | $195,000 |
| 2021 | $5,457 | $431,300 | $291,200 | $140,100 |
| 2019 | $4,356 | $375,900 | $239,800 | $136,100 |
| 2018 | $4,325 | $338,500 | $208,200 | $130,300 |
| 2017 | $3,952 | $299,700 | $179,200 | $120,500 |
| 2016 | $3,621 | $238,400 | $142,300 | $96,100 |
| 2014 | $3,246 | $226,900 | $133,600 | $93,300 |
| 2013 | $3,246 | $202,100 | $118,400 | $83,700 |
Source: Public Records
Map
Nearby Homes
- 8501 143rd St E
- 15006 81st Avenue Ct E
- 15126 82nd Ave E
- 15220 88th Avenue Ct E
- 9208 147th St E
- 14308 92nd Ave E
- 7804 148th Street Ct E
- 15010 93rd Ave E
- 15507 82nd Ave E
- 9320 152nd St E
- 8728 136th St E
- 15605 79th Ave E Unit 10
- 15808 84th Ave E
- 15714 82nd Ave E Unit 5354
- 14507 73rd Avenue Ct E
- 15823 83rd Ave E
- 7427 154th St E Unit 14
- 8904 158th St E
- 8005 134th Street Ct E
- 7705 158th Street Ct E Unit 119
- 14719 86th Ave E
- 14705 85th Avenue Ct E
- 14701 85th Avenue Ct E
- 14705 85th Avenue Ct E
- 14709 85th Avenue Ct E
- 14701 85th Avenue Ct E
- 8602 146th Street Ct E
- 8606 146th Street Ct E
- 14627 85th Avenue Ct E
- 8606 146th Stct E
- 14722 86th Ave E
- 8610 146th Street Ct E
- 14806 87th Ave E
- 14621 85th E
- 14621 85th Avenue Ct E
- 14706 85th Avenue Ct E
- 14706 85th Avenue Ct E
- 14710 85th Avenue Ct E
- 14702 85th Avenue Ct E
- 14702 85th Avenue Ct E