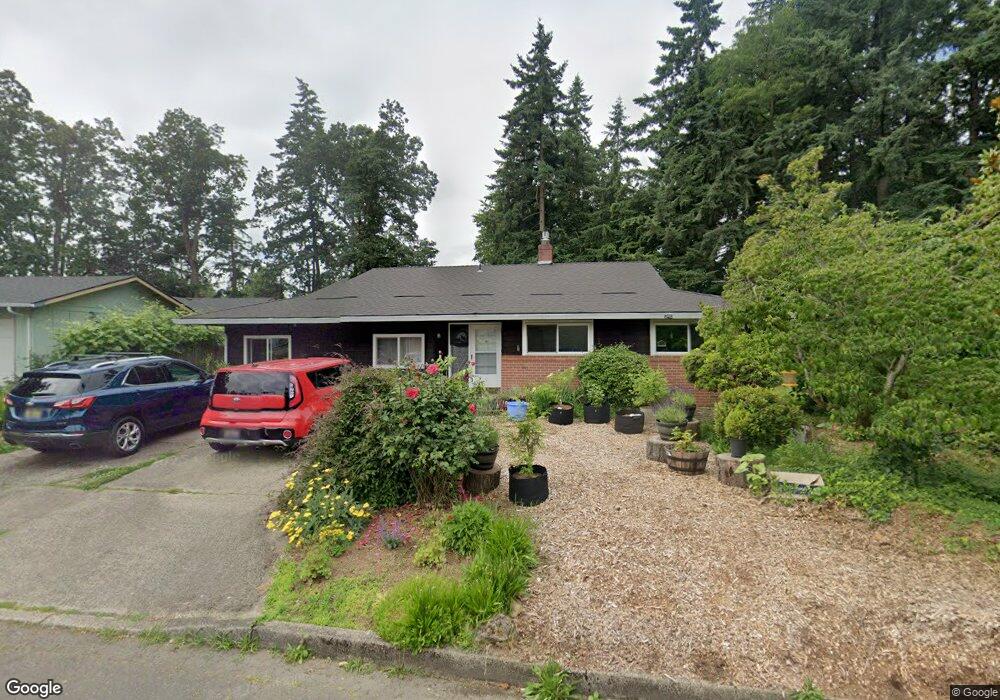
14711 SE Raintree Ct Milwaukie, OR 97267
Estimated Value: $542,977 - $565,000
5
Beds
3
Baths
2,144
Sq Ft
$258/Sq Ft
Est. Value
About This Home
This home is located at 14711 SE Raintree Ct, Milwaukie, OR 97267 and is currently estimated at $553,744, approximately $258 per square foot. 14711 SE Raintree Ct is a home located in Clackamas County with nearby schools including View Acres Elementary School, Alder Creek Middle School, and Rex Putnam High School.
Ownership History
Date
Name
Owned For
Owner Type
Purchase Details
Closed on
Mar 5, 2015
Sold by
Miller Darlene M
Bought by
Winward Jeffery R
Current Estimated Value
Home Financials for this Owner
Home Financials are based on the most recent Mortgage that was taken out on this home.
Original Mortgage
$171,200
Outstanding Balance
$130,053
Interest Rate
3.54%
Mortgage Type
New Conventional
Estimated Equity
$423,691
Purchase Details
Closed on
Apr 2, 1998
Sold by
Thomas Rodney L
Bought by
Miller Darlene M
Home Financials for this Owner
Home Financials are based on the most recent Mortgage that was taken out on this home.
Original Mortgage
$110,625
Interest Rate
7%
Purchase Details
Closed on
Aug 29, 1996
Sold by
Roberts Grace M
Bought by
Thomas Rodney L
Home Financials for this Owner
Home Financials are based on the most recent Mortgage that was taken out on this home.
Original Mortgage
$121,500
Interest Rate
8.2%
Create a Home Valuation Report for This Property
The Home Valuation Report is an in-depth analysis detailing your home's value as well as a comparison with similar homes in the area
Home Values in the Area
Average Home Value in this Area
Purchase History
| Date | Buyer | Sale Price | Title Company |
|---|---|---|---|
| Winward Jeffery R | $122,000 | Old Republic Title | |
| Miller Darlene M | $147,500 | Chicago Title Insurance Co | |
| Thomas Rodney L | $135,000 | Chicago Title Insurance Co |
Source: Public Records
Mortgage History
| Date | Status | Borrower | Loan Amount |
|---|---|---|---|
| Open | Winward Jeffery R | $171,200 | |
| Previous Owner | Miller Darlene M | $110,625 | |
| Previous Owner | Thomas Rodney L | $121,500 |
Source: Public Records
Tax History Compared to Growth
Tax History
| Year | Tax Paid | Tax Assessment Tax Assessment Total Assessment is a certain percentage of the fair market value that is determined by local assessors to be the total taxable value of land and additions on the property. | Land | Improvement |
|---|---|---|---|---|
| 2024 | $4,888 | $261,048 | -- | -- |
| 2023 | $4,888 | $253,445 | $0 | $0 |
| 2022 | $4,492 | $246,064 | $0 | $0 |
| 2021 | $4,327 | $238,898 | $0 | $0 |
| 2020 | $4,187 | $231,940 | $0 | $0 |
| 2019 | $4,127 | $225,185 | $0 | $0 |
| 2018 | $3,606 | $218,626 | $0 | $0 |
| 2017 | $3,489 | $212,258 | $0 | $0 |
| 2016 | $3,362 | $206,076 | $0 | $0 |
| 2015 | $3,265 | $200,074 | $0 | $0 |
| 2014 | $3,066 | $194,247 | $0 | $0 |
Source: Public Records
Map
Nearby Homes
- 14437 SE Hillgrove Ct
- 15109 SE Oatfield Rd
- 14824 SE Kellogg Ave
- 4915 SE Hill Rd
- 3200 SE Silver Leaf Ln Unit 33
- 2850 SE Oak Grove Blvd
- 13952 SE Piper Cub Way
- 13945 SE Piper Cub Way
- 15315 SE East Ave
- 4816 SE Robin Rd
- 5012 SE Robin Ct
- 15915 SE Harold Ave
- 3396 SE Loeffelman Rd
- 4880 SE Aldercrest Rd
- 3500 SE Concord Rd Unit 78
- 2424 SE Pine Ln
- 16855 SE Oatfield Rd
- 4917 SE Aldercrest Rd
- 13770 SE Linden Ln
- 3419 SE Kingsley Rd
- 14739 SE Raintree Ct
- 14665 SE Raintree Ct
- 14808 SE Oatfield Rd
- 14751 SE Raintree Ct
- 14664 SE Raintree Ct
- 14633 SE Raintree Ct
- 14736 SE Raintree Ct
- 14812 SE Oatfield Rd
- 14622 SE Raintree Ct
- 14763 SE Raintree Ct
- 14758 SE Raintree Ct
- 3808 SE Hager Ln
- 3866 SE Hager Ln
- 14806 SE Oatfield Rd
- 14760 SE Raintree Ct
- 3752 SE Hager Ln
- 14775 SE Raintree Ct
- 3916 SE Hager Ln
- 3939 SE Oatfield Ct
- 14810 SE Oatfield Rd