Estimated Value: $433,000 - $456,014
3
Beds
2
Baths
1,568
Sq Ft
$282/Sq Ft
Est. Value
About This Home
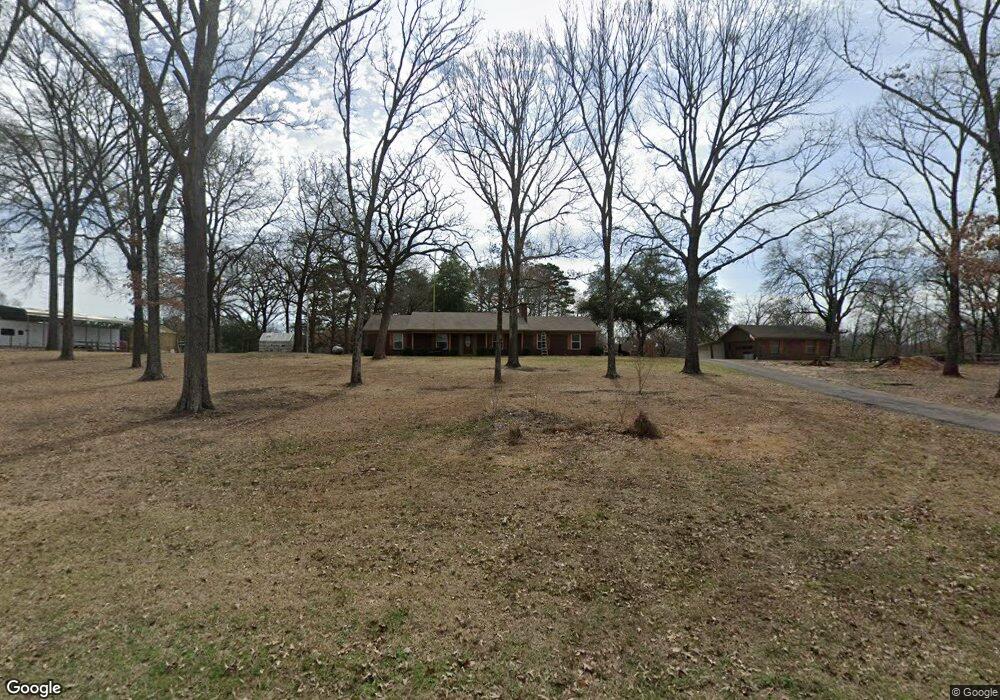
This home is located at 14714 County Road 2205, Tyler, TX 75707 and is currently estimated at $441,754, approximately $281 per square foot. 14714 County Road 2205 is a home located in Smith County with nearby schools including Kissam Intermediate School, Jackson Elementary School, and Chapel Hill Middle School.
Ownership History
Date
Name
Owned For
Owner Type
Purchase Details
Closed on
Aug 5, 2022
Sold by
Ellis Ronald J and Ellis Sandra K
Bought by
Waterman Jeffery T and Waterman Cynthia L
Current Estimated Value
Home Financials for this Owner
Home Financials are based on the most recent Mortgage that was taken out on this home.
Original Mortgage
$310,000
Outstanding Balance
$296,301
Interest Rate
5.81%
Mortgage Type
New Conventional
Estimated Equity
$145,453
Purchase Details
Closed on
Aug 24, 2015
Sold by
Poindexter Jimmy Alfred and Poindexter Kristi B
Bought by
Ellis Ronald J and Ellis Sandra K
Home Financials for this Owner
Home Financials are based on the most recent Mortgage that was taken out on this home.
Original Mortgage
$180,000
Interest Rate
4.08%
Mortgage Type
New Conventional
Purchase Details
Closed on
Nov 29, 2007
Sold by
Henry Kathy Sue Poindexter
Bought by
Poindexter Jimmy Alfred
Create a Home Valuation Report for This Property
The Home Valuation Report is an in-depth analysis detailing your home's value as well as a comparison with similar homes in the area
Home Values in the Area
Average Home Value in this Area
Purchase History
| Date | Buyer | Sale Price | Title Company |
|---|---|---|---|
| Waterman Jeffery T | -- | Robertson Anschutz Vetters Llc | |
| Ellis Ronald J | -- | None Available | |
| Poindexter Jimmy Alfred | -- | None Available | |
| Poindexter Jimmy Alfred | -- | None Available |
Source: Public Records
Mortgage History
| Date | Status | Borrower | Loan Amount |
|---|---|---|---|
| Open | Waterman Jeffery T | $310,000 | |
| Previous Owner | Ellis Ronald J | $180,000 |
Source: Public Records
Tax History Compared to Growth
Tax History
| Year | Tax Paid | Tax Assessment Tax Assessment Total Assessment is a certain percentage of the fair market value that is determined by local assessors to be the total taxable value of land and additions on the property. | Land | Improvement |
|---|---|---|---|---|
| 2025 | $4,684 | $350,950 | $95,995 | $254,955 |
| 2024 | $4,684 | $335,276 | $74,269 | $261,007 |
| 2023 | $6,811 | $398,785 | $74,269 | $324,516 |
| 2022 | $5,145 | $352,267 | $66,910 | $285,357 |
| 2021 | $4,985 | $292,531 | $55,758 | $236,773 |
| 2020 | $5,197 | $292,694 | $55,758 | $236,936 |
| 2019 | $5,060 | $273,210 | $55,758 | $217,452 |
| 2018 | $4,810 | $260,773 | $55,758 | $205,015 |
| 2017 | $4,416 | $238,132 | $36,540 | $201,592 |
| 2016 | $4,315 | $232,661 | $36,540 | $196,121 |
| 2015 | $2,037 | $118,817 | $36,540 | $82,277 |
| 2014 | $2,037 | $119,610 | $36,540 | $83,070 |
Source: Public Records
Map
Nearby Homes
- 10908 & 10914 County Road 225
- 10788 County Road 225
- 14951 County Road 2205
- 13807 County Road 220
- 13332 White Tail Dr
- 13800 County Road 220
- 13310 White Tail Dr
- 13311 White Tail Dr
- 13311 White Tail Dr Unit 1
- 0000 State Highway 64
- 10973 Fm 3226
- 13594 State Highway 64 E
- 15253 State Highway 64 E
- 16455 Fm 850
- TBD County Road 2301
- 7789 Lakeshore Dr
- 9961 Creek Bend Dr
- 9367 County Road 2301
- 12195 Fm 3226
- 10680 County Road 214
- 14714 14714 C R 2205
- 14714 C R 2205
- 14730 County Road 2205
- 14676 County Road 2205
- 14715 County Road 2205
- 14685 County Road 2205
- 14780 County Road 2205
- 14634 County Road 2205
- 14673 County Road 2205
- 14761 County Road 2205
- 10672 County Road 225
- 14590 County Road 2205
- 10691 County Road 225
- 14861 County Road 2205 Trail
- 10679 County Road 225
- 14881 County Road 2205
- 14482 County Road 2205
- 10758 County Road 225
- 14483 County Road 2205
- 14927 County Road 2205