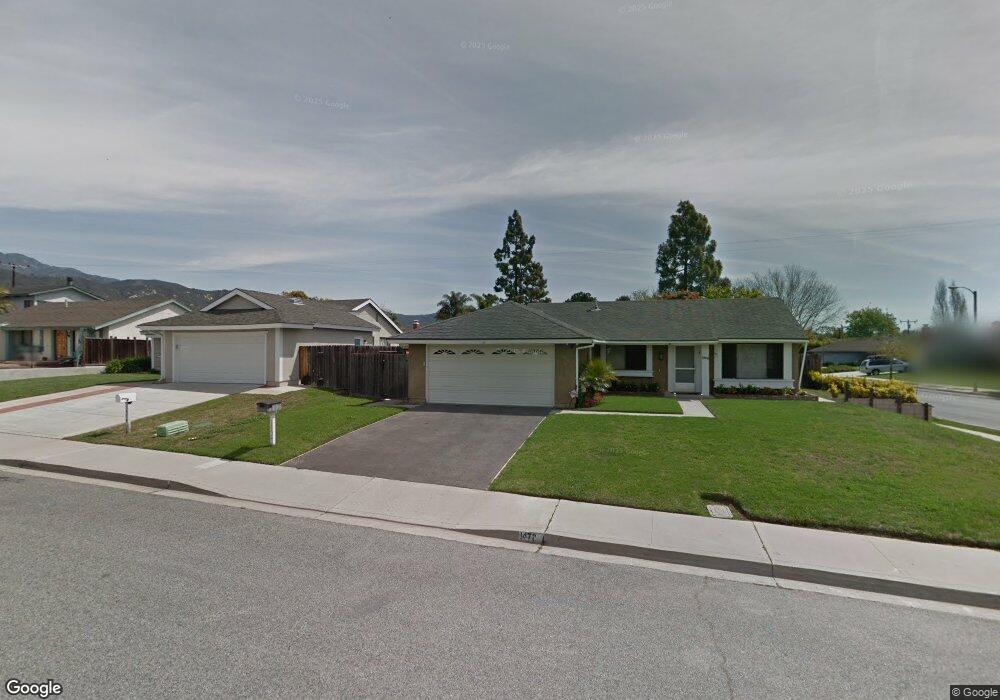
1472 Azalea Dr Carpinteria, CA 93013
Santa Monica-El Carro NeighborhoodEstimated Value: $1,205,000 - $1,508,000
4
Beds
2
Baths
1,335
Sq Ft
$1,008/Sq Ft
Est. Value
About This Home
This home is located at 1472 Azalea Dr, Carpinteria, CA 93013 and is currently estimated at $1,346,056, approximately $1,008 per square foot. 1472 Azalea Dr is a home located in Santa Barbara County with nearby schools including Carpinteria Senior High School, The Howard School, and Cate School.
Ownership History
Date
Name
Owned For
Owner Type
Purchase Details
Closed on
Oct 19, 2010
Sold by
Moore Martin Lee and Moore Dixie Lee
Bought by
Moore Martin Lee and Moore Dixie Lee
Current Estimated Value
Home Financials for this Owner
Home Financials are based on the most recent Mortgage that was taken out on this home.
Original Mortgage
$280,000
Outstanding Balance
$184,582
Interest Rate
4.33%
Mortgage Type
New Conventional
Estimated Equity
$1,161,474
Purchase Details
Closed on
Jul 23, 2009
Sold by
Moore Martin L and Moore Dixie L
Bought by
Moore Martin Lee and Moore Dixie Lee
Purchase Details
Closed on
Jan 23, 1998
Sold by
Hamilton Sharon L
Bought by
Moore Martin L and Moore Dixie L
Home Financials for this Owner
Home Financials are based on the most recent Mortgage that was taken out on this home.
Original Mortgage
$217,500
Interest Rate
6.97%
Create a Home Valuation Report for This Property
The Home Valuation Report is an in-depth analysis detailing your home's value as well as a comparison with similar homes in the area
Home Values in the Area
Average Home Value in this Area
Purchase History
| Date | Buyer | Sale Price | Title Company |
|---|---|---|---|
| Moore Martin Lee | -- | First American Title Company | |
| Moore Martin Lee | -- | First American Title Company | |
| Moore Martin Lee | -- | None Available | |
| Moore Martin L | $290,000 | Stewart Title |
Source: Public Records
Mortgage History
| Date | Status | Borrower | Loan Amount |
|---|---|---|---|
| Open | Moore Martin Lee | $280,000 | |
| Closed | Moore Martin L | $217,500 | |
| Closed | Moore Martin L | $43,500 |
Source: Public Records
Tax History
| Year | Tax Paid | Tax Assessment Tax Assessment Total Assessment is a certain percentage of the fair market value that is determined by local assessors to be the total taxable value of land and additions on the property. | Land | Improvement |
|---|---|---|---|---|
| 2025 | $5,849 | $479,682 | $215,550 | $264,132 |
| 2023 | $5,849 | $461,057 | $207,181 | $253,876 |
| 2022 | $5,541 | $442,331 | $203,119 | $239,212 |
| 2021 | $5,346 | $427,777 | $199,137 | $228,640 |
| 2020 | $5,273 | $423,392 | $197,096 | $226,296 |
| 2019 | $5,158 | $415,091 | $193,232 | $221,859 |
| 2018 | $5,062 | $406,953 | $189,444 | $217,509 |
| 2017 | $4,962 | $398,975 | $185,730 | $213,245 |
| 2016 | $4,877 | $391,153 | $182,089 | $209,064 |
| 2014 | $4,557 | $377,732 | $175,841 | $201,891 |
Source: Public Records
Map
Nearby Homes
- 1350 Tomol St
- 4677 Carpinteria Ave Unit P
- 4631 Carpinteria Ave
- 4725 9th St Unit 31
- 4869 Carpinteria Ave
- 4436 Mesa Ln
- 3080 Foothill Rd
- 5118 Concord Place
- 4501 Carpinteria Ave Unit C
- 910 Pear St
- 4731 4th St
- 349 Ash Ave Unit Spc 17
- 349 Ash Ave Unit 45
- 4264 Carpinteria Ave Unit 5
- 5402 Cameo Rd
- 131 Polo Dr
- 3250 Polo Way
- 100 Polo Way
- 105 Polo Way
- 220 Elm Ave Unit 9
Your Personal Tour Guide
Ask me questions while you tour the home.