Estimated Value: $673,000 - $763,000
4
Beds
3
Baths
2,170
Sq Ft
$322/Sq Ft
Est. Value
About This Home
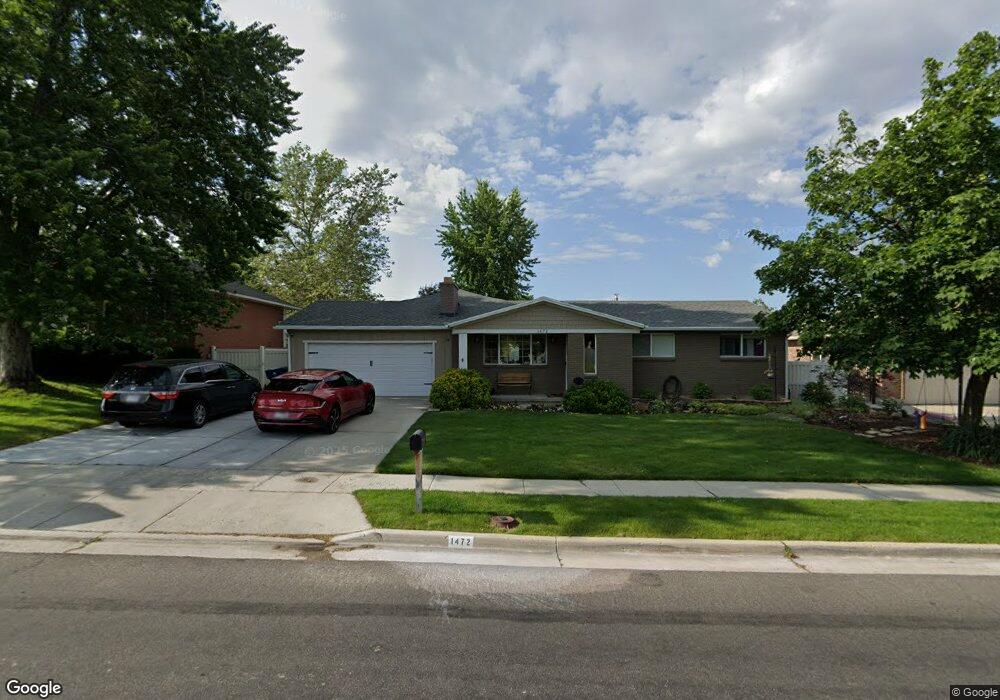
This home is located at 1472 Granada Dr, Sandy, UT 84093 and is currently estimated at $699,558, approximately $322 per square foot. 1472 Granada Dr is a home located in Salt Lake County with nearby schools including Silver Mesa Elementary School, Union Middle School, and Hillcrest High School.
Ownership History
Date
Name
Owned For
Owner Type
Purchase Details
Closed on
Aug 21, 2020
Sold by
Heaps Colby M
Bought by
Heaps Colby and Heaps Rachel
Current Estimated Value
Home Financials for this Owner
Home Financials are based on the most recent Mortgage that was taken out on this home.
Original Mortgage
$400,000
Outstanding Balance
$356,375
Interest Rate
2.9%
Mortgage Type
New Conventional
Estimated Equity
$343,183
Purchase Details
Closed on
Jan 3, 2013
Sold by
Bess Brandon
Bought by
Heaps Colby M
Home Financials for this Owner
Home Financials are based on the most recent Mortgage that was taken out on this home.
Original Mortgage
$232,750
Interest Rate
3.27%
Mortgage Type
New Conventional
Purchase Details
Closed on
Aug 26, 2010
Sold by
Quin Harkin Dominic
Bought by
Bess Brandon
Home Financials for this Owner
Home Financials are based on the most recent Mortgage that was taken out on this home.
Original Mortgage
$179,755
Interest Rate
3.25%
Mortgage Type
FHA
Purchase Details
Closed on
Jan 17, 2007
Sold by
Capps Amy L and Capps Douglas Scott
Bought by
Quin Harkin Dominic
Home Financials for this Owner
Home Financials are based on the most recent Mortgage that was taken out on this home.
Original Mortgage
$51,400
Interest Rate
6.1%
Mortgage Type
Credit Line Revolving
Purchase Details
Closed on
Feb 26, 2004
Sold by
Capps Douglas Scott and Capps Amy L
Bought by
Capps Douglas Scott and Capps Amy L
Home Financials for this Owner
Home Financials are based on the most recent Mortgage that was taken out on this home.
Original Mortgage
$136,500
Interest Rate
4.94%
Mortgage Type
New Conventional
Purchase Details
Closed on
Aug 30, 2000
Sold by
Grider Michael A and Grider Rita L
Bought by
Capps Douglas Scott and Capps Amy L
Home Financials for this Owner
Home Financials are based on the most recent Mortgage that was taken out on this home.
Original Mortgage
$110,500
Interest Rate
8.2%
Purchase Details
Closed on
Oct 30, 1997
Sold by
Mathews Gary J and Mathews Wendelin L
Bought by
Grider Michael A and Grider Rita L
Home Financials for this Owner
Home Financials are based on the most recent Mortgage that was taken out on this home.
Original Mortgage
$106,273
Interest Rate
7.36%
Purchase Details
Closed on
Apr 23, 1996
Sold by
Mathews Wendelin L
Bought by
Mathews Gary J and Mathews Wendelin L
Home Financials for this Owner
Home Financials are based on the most recent Mortgage that was taken out on this home.
Original Mortgage
$90,000
Interest Rate
7.32%
Create a Home Valuation Report for This Property
The Home Valuation Report is an in-depth analysis detailing your home's value as well as a comparison with similar homes in the area
Home Values in the Area
Average Home Value in this Area
Purchase History
| Date | Buyer | Sale Price | Title Company |
|---|---|---|---|
| Heaps Colby | -- | Metro National Title | |
| Heaps Colby M | -- | Cottonwood Title Insurance A | |
| Bess Brandon | -- | Legends Title Llc | |
| Quin Harkin Dominic | -- | Orion Title | |
| Capps Douglas Scott | -- | Executive Title Ins Agency | |
| Capps Douglas Scott | -- | Meridian Title | |
| Grider Michael A | -- | -- | |
| Mathews Gary J | -- | -- |
Source: Public Records
Mortgage History
| Date | Status | Borrower | Loan Amount |
|---|---|---|---|
| Open | Heaps Colby | $400,000 | |
| Closed | Heaps Colby M | $232,750 | |
| Previous Owner | Bess Brandon | $179,755 | |
| Previous Owner | Quin Harkin Dominic | $51,400 | |
| Previous Owner | Quin Harkin Dominic | $205,300 | |
| Previous Owner | Capps Douglas Scott | $136,500 | |
| Previous Owner | Capps Douglas Scott | $110,500 | |
| Previous Owner | Grider Michael A | $106,273 | |
| Previous Owner | Mathews Gary J | $90,000 |
Source: Public Records
Tax History
| Year | Tax Paid | Tax Assessment Tax Assessment Total Assessment is a certain percentage of the fair market value that is determined by local assessors to be the total taxable value of land and additions on the property. | Land | Improvement |
|---|---|---|---|---|
| 2025 | $3,440 | $676,200 | $201,600 | $474,600 |
| 2024 | $3,440 | $644,800 | $190,200 | $454,600 |
| 2023 | $3,389 | $634,100 | $180,800 | $453,300 |
| 2022 | $3,484 | $641,300 | $177,300 | $464,000 |
| 2021 | $2,636 | $413,100 | $132,600 | $280,500 |
| 2020 | $2,194 | $324,500 | $132,600 | $191,900 |
| 2019 | $2,162 | $311,900 | $125,100 | $186,800 |
| 2016 | $1,700 | $237,200 | $125,100 | $112,100 |
Source: Public Records
Map
Nearby Homes
- 1393 E Galaxie Dr
- 1430 E 8685 S
- 1579 E 8730 S
- 1630 E Plata Way
- 1492 E Sandy Hills Dr
- 1371 Sudbury Ave
- 8935 Quarry Stone Way
- 1138 E Quarry Stone Way
- 8971 Valley Bend Ct
- 8638 Piper Ln
- 1798 E Sunrise Meadow Dr
- 1779 E Mombo Dr
- 9443 Electra St
- 8411 S 1475 E
- 1972 Everleigh Cir
- 1448 E Estrellita Dr
- 1100 E Webster Dr
- 8643 Vaquero Dr
- 9633 S 1210 E
- 1627 E Mulberry Way
- 1472 E Granada Dr
- 1460 Granada Dr
- 1492 E Granada Dr
- 1492 Granada Dr
- 1477 E Amalfi Way
- 1477 Amalfi Way
- 1452 Granada Dr
- 1467 E Amalfi Way
- 1467 Amalfi Way
- 1510 E Granada Dr
- 1510 Granada Dr
- 1465 Granada Dr
- 8965 Capella Way
- 9024 Waters Cir
- 9024 S Waters Cir
- 9025 Bonnet Dr
- 1457 E Granada Dr
- 9032 Waters Cir
- 9032 S Waters Cir
- 1457 Granada Dr