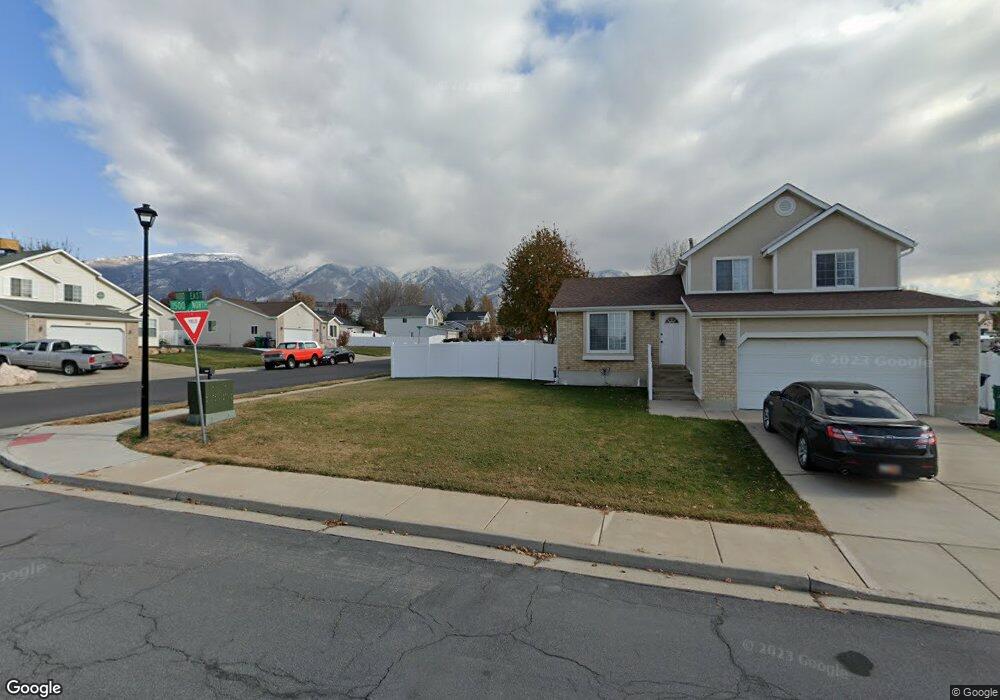
1472 N 1100 E Layton, UT 84040
Estimated Value: $479,000 - $529,000
4
Beds
2
Baths
2,190
Sq Ft
$228/Sq Ft
Est. Value
About This Home
This home is located at 1472 N 1100 E, Layton, UT 84040 and is currently estimated at $500,134, approximately $228 per square foot. 1472 N 1100 E is a home located in Davis County with nearby schools including King Elementary School, Central Davis Junior High School, and Layton High School.
Ownership History
Date
Name
Owned For
Owner Type
Purchase Details
Closed on
Oct 31, 2012
Sold by
Loosli D Spencer and Loosli Kandice
Bought by
Winder Nickolas and Winder Taylee
Current Estimated Value
Home Financials for this Owner
Home Financials are based on the most recent Mortgage that was taken out on this home.
Original Mortgage
$7,600
Outstanding Balance
$5,243
Interest Rate
3.43%
Mortgage Type
Unknown
Estimated Equity
$494,891
Purchase Details
Closed on
Oct 21, 2005
Sold by
American General Finance Inc
Bought by
Loosli D Spencer and Loosli Kandice
Home Financials for this Owner
Home Financials are based on the most recent Mortgage that was taken out on this home.
Original Mortgage
$28,800
Interest Rate
5.68%
Mortgage Type
Stand Alone Second
Purchase Details
Closed on
May 18, 2005
Sold by
Walkup Terry J and Walkup Debra M
Bought by
American General Finance Inc
Create a Home Valuation Report for This Property
The Home Valuation Report is an in-depth analysis detailing your home's value as well as a comparison with similar homes in the area
Home Values in the Area
Average Home Value in this Area
Purchase History
| Date | Buyer | Sale Price | Title Company |
|---|---|---|---|
| Winder Nickolas | -- | First American Title Company | |
| Loosli D Spencer | -- | Equity Title Ins Agency Inc | |
| American General Finance Inc | $117,300 | -- |
Source: Public Records
Mortgage History
| Date | Status | Borrower | Loan Amount |
|---|---|---|---|
| Open | Winder Nickolas | $7,600 | |
| Open | Winder Nickolas | $170,356 | |
| Previous Owner | Loosli D Spencer | $28,800 | |
| Previous Owner | Loosli D Spencer | $115,200 |
Source: Public Records
Tax History
| Year | Tax Paid | Tax Assessment Tax Assessment Total Assessment is a certain percentage of the fair market value that is determined by local assessors to be the total taxable value of land and additions on the property. | Land | Improvement |
|---|---|---|---|---|
| 2025 | $2,306 | $242,000 | $120,198 | $121,802 |
| 2024 | $2,195 | $232,100 | $142,501 | $89,599 |
| 2023 | $2,173 | $405,000 | $191,412 | $213,588 |
| 2022 | $2,315 | $234,300 | $102,737 | $131,563 |
| 2021 | $2,120 | $320,000 | $156,457 | $163,543 |
| 2020 | $1,795 | $260,000 | $127,089 | $132,911 |
| 2019 | $1,777 | $252,000 | $113,442 | $138,558 |
| 2018 | $1,615 | $230,000 | $88,622 | $141,378 |
| 2016 | $1,380 | $101,365 | $46,580 | $54,785 |
| 2015 | $1,327 | $92,510 | $49,032 | $43,478 |
| 2014 | $1,252 | $89,279 | $49,032 | $40,247 |
| 2013 | -- | $79,264 | $22,748 | $56,516 |
Source: Public Records
Map
Nearby Homes
- 1258 E North Lisa St
- 1048 E Cherry Ln
- 1340 E Hollyhock Way
- 1266 E Larkspur Way
- 1354 E Hollyhock Way
- 1350 Kays Creek Dr
- 1305 E Larkspur Way
- 1476 Kays Creek Dr
- 1156 Cherrywood Dr
- 1465 E Sego Lily Ct
- 1540 E Primrose Ln
- 1033 E 825 N
- 1099 E 2125 N
- 997 E 825 N
- 1545 E 975 N
- 2096 N 1450 E
- 1843 Hayes Dr
- 1120 E 2200 N
- 1148 N 1875 E Unit 2
- 1975 E 1425 N
Your Personal Tour Guide
Ask me questions while you tour the home.