Estimated Value: $409,618 - $451,000
4
Beds
3
Baths
2,429
Sq Ft
$177/Sq Ft
Est. Value
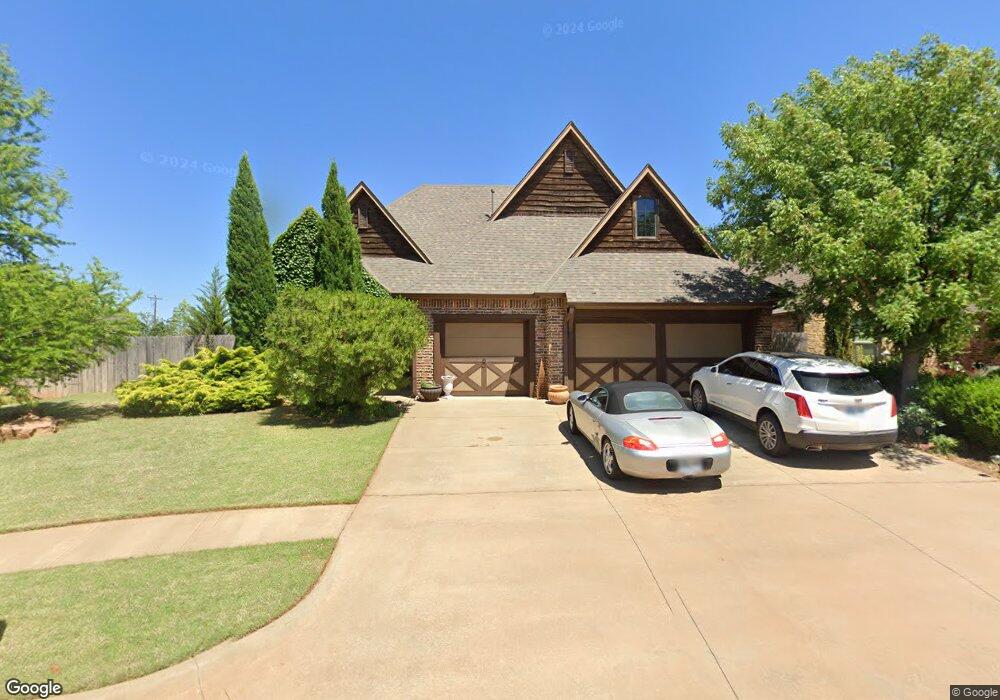
About This Home
This home is located at 14728 Avignon Ln, Yukon, OK 73099 and is currently estimated at $430,655, approximately $177 per square foot. 14728 Avignon Ln is a home located in Canadian County with nearby schools including Stone Ridge Elementary School, Piedmont Intermediate Elementary School, and Piedmont Middle School.
Ownership History
Date
Name
Owned For
Owner Type
Purchase Details
Closed on
Jun 24, 2016
Sold by
Michelli Marcus and Michelli Pamela
Bought by
Reyes Stanley Raymond
Current Estimated Value
Home Financials for this Owner
Home Financials are based on the most recent Mortgage that was taken out on this home.
Original Mortgage
$280,250
Outstanding Balance
$223,555
Interest Rate
3.64%
Mortgage Type
New Conventional
Estimated Equity
$207,100
Purchase Details
Closed on
Dec 17, 2008
Sold by
Seagull Homes Inc
Bought by
Michelli Marcus and Michelli Pamela
Home Financials for this Owner
Home Financials are based on the most recent Mortgage that was taken out on this home.
Original Mortgage
$253,000
Interest Rate
6.19%
Mortgage Type
New Conventional
Purchase Details
Closed on
Apr 25, 2008
Sold by
Paradigm Development Group Llc
Bought by
Seagull Homes Inc
Create a Home Valuation Report for This Property
The Home Valuation Report is an in-depth analysis detailing your home's value as well as a comparison with similar homes in the area
Home Values in the Area
Average Home Value in this Area
Purchase History
| Date | Buyer | Sale Price | Title Company |
|---|---|---|---|
| Reyes Stanley Raymond | $295,000 | Chicago Title Oklahoma | |
| Michelli Marcus | $246,375 | None Available | |
| Seagull Homes Inc | $31,500 | None Available |
Source: Public Records
Mortgage History
| Date | Status | Borrower | Loan Amount |
|---|---|---|---|
| Open | Reyes Stanley Raymond | $280,250 | |
| Previous Owner | Michelli Marcus | $253,000 |
Source: Public Records
Tax History Compared to Growth
Tax History
| Year | Tax Paid | Tax Assessment Tax Assessment Total Assessment is a certain percentage of the fair market value that is determined by local assessors to be the total taxable value of land and additions on the property. | Land | Improvement |
|---|---|---|---|---|
| 2024 | $5,131 | $44,507 | $6,921 | $37,586 |
| 2023 | $5,131 | $42,388 | $6,786 | $35,602 |
| 2022 | $4,956 | $40,370 | $6,622 | $33,748 |
| 2021 | $4,841 | $38,448 | $5,400 | $33,048 |
| 2020 | $4,719 | $36,727 | $5,400 | $31,327 |
| 2019 | $4,774 | $38,849 | $5,400 | $33,449 |
| 2018 | $4,602 | $36,999 | $5,400 | $31,599 |
| 2017 | $4,578 | $36,999 | $5,400 | $31,599 |
| 2016 | $4,336 | $38,576 | $5,400 | $33,176 |
| 2015 | $3,746 | $34,568 | $4,800 | $29,768 |
| 2014 | $3,746 | $33,561 | $4,800 | $28,761 |
Source: Public Records
Map
Nearby Homes
- 9028 NW 147th Place
- 9028 NW 146th St
- 9021 NW 148th Place
- 14908 Arbor Ct
- 14509 Privas Ln
- 9053 NW 149th Terrace
- 9064 NW 149th Terrace
- 9053 NW 149th St
- 9108 NW 149th Terrace
- 9057 NW 149th Terrace
- Cali Plan at Montereau
- Denton Plan at Montereau
- JUSTIN Plan at Montereau
- Elgin Plan at Montereau
- KINGSTON Plan at Montereau
- LAREDO Plan at Montereau
- BELLEVUE Plan at Montereau
- 9105 NW 149th Terrace
- Mallard Plan at Montereau
- Magnolia Plan at Montereau
- 14728 Avignon
- 14724 Avignon Ln
- 14720 Avignon Ln
- 9009 NW 147th Terrace
- 14736 Avignon Ln
- 14716 Avignon Ln
- 9008 NW 147th Place
- 9013 NW 147th Terrace
- 14800 Avignon Ln
- 9012 NW 147th Terrace
- 14804 Avignon Ln
- 9017 NW 147th Terrace
- 14709 Avignon Ln
- 9016 NW 147th Place
- 9009 NW 147th Place
- 14808 Avignon Ln
- 9021 NW 147th Terrace
- 14705 Avignon Ln
- 9013 NW 147th Place
- 9020 NW 147th Place