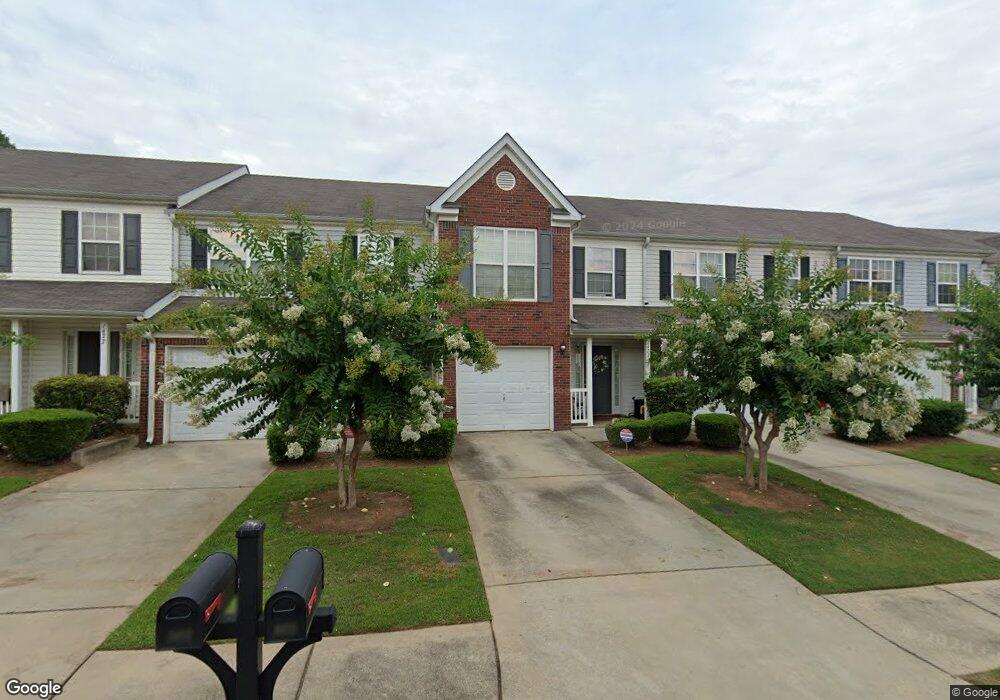
1473 April Ln Morrow, GA 30260
Estimated Value: $201,878 - $225,000
3
Beds
3
Baths
1,347
Sq Ft
$159/Sq Ft
Est. Value
About This Home
This home is located at 1473 April Ln, Morrow, GA 30260 and is currently estimated at $213,720, approximately $158 per square foot. 1473 April Ln is a home located in Clayton County with nearby schools including James Jackson Elementary School, Jonesboro Middle School, and Mount Zion High School.
Ownership History
Date
Name
Owned For
Owner Type
Purchase Details
Closed on
Dec 29, 2008
Sold by
Bear Stearns A Trust 2006-3
Bought by
Barber Brent
Current Estimated Value
Home Financials for this Owner
Home Financials are based on the most recent Mortgage that was taken out on this home.
Original Mortgage
$35,950
Outstanding Balance
$23,085
Interest Rate
5.48%
Mortgage Type
New Conventional
Estimated Equity
$190,635
Purchase Details
Closed on
Sep 2, 2008
Sold by
Delphin Jemeka
Bought by
Bear Stearns Alt-A Trust 2006-
Purchase Details
Closed on
Feb 3, 2006
Sold by
Delphin Jemeka
Bought by
Delphin Jemeka and Delphin Curtis
Purchase Details
Closed on
Jul 11, 2005
Sold by
Southside Dev Inc
Bought by
Gt Architecture Contractors Corp
Home Financials for this Owner
Home Financials are based on the most recent Mortgage that was taken out on this home.
Original Mortgage
$2,126,443
Interest Rate
5.46%
Create a Home Valuation Report for This Property
The Home Valuation Report is an in-depth analysis detailing your home's value as well as a comparison with similar homes in the area
Home Values in the Area
Average Home Value in this Area
Purchase History
| Date | Buyer | Sale Price | Title Company |
|---|---|---|---|
| Barber Brent | $38,800 | -- | |
| Bear Stearns Alt-A Trust 2006- | $102,300 | -- | |
| Delphin Jemeka | -- | -- | |
| Gt Architecture Contractors Corp | $728,000 | -- |
Source: Public Records
Mortgage History
| Date | Status | Borrower | Loan Amount |
|---|---|---|---|
| Open | Barber Brent | $35,950 | |
| Previous Owner | Gt Architecture Contractors Corp | $2,126,443 |
Source: Public Records
Tax History Compared to Growth
Tax History
| Year | Tax Paid | Tax Assessment Tax Assessment Total Assessment is a certain percentage of the fair market value that is determined by local assessors to be the total taxable value of land and additions on the property. | Land | Improvement |
|---|---|---|---|---|
| 2024 | $2,936 | $84,280 | $6,400 | $77,880 |
| 2023 | $2,894 | $80,160 | $6,400 | $73,760 |
| 2022 | $2,047 | $61,200 | $6,400 | $54,800 |
| 2021 | $1,457 | $45,920 | $6,400 | $39,520 |
| 2020 | $1,239 | $40,030 | $6,400 | $33,630 |
| 2019 | $992 | $33,488 | $5,600 | $27,888 |
| 2018 | $839 | $29,726 | $5,600 | $24,126 |
| 2017 | $607 | $23,976 | $5,600 | $18,376 |
| 2016 | $473 | $20,686 | $5,600 | $15,086 |
| 2015 | $450 | $0 | $0 | $0 |
| 2014 | $403 | $19,168 | $8,400 | $10,768 |
Source: Public Records
Map
Nearby Homes
- 7243 April Ct
- 7104 Georges Way
- 248 Commons Dr
- 7431 Battlecreek Ln
- 7581 Livingston Dr
- 7672 Echo Ln
- 7621 Raleigh Ln
- 7391 Garnet Dr
- 1161 Gable Terrace
- 7592 Didwell Ct
- 1608 Bogota Way
- 139 Cecelia Cir
- 1113 Lakeview Dr
- 7583 Sunstone Dr
- 896 King Rd
- 2158 Weybridge Dr
- 2084 Jadestone Ct
- 937 Ohara Dr
- 1699 Brenda Dr Unit 2
- 1475 April Ln Unit 1475
- 1475 April Ln Unit 39
- 1475 April Ln
- 1471 April Ln
- 1477 April Ln
- 1477 April Ln Unit 1477
- 1469 April Ln
- 1467 April Ln
- 1479 April Ln
- 1465 April Ln
- 1463 April Ln
- 7087 Georges Way
- 7085 Georges Way
- 7089 Georges Way
- 7091 Georges Way
- 7093 Georges Way
- 1461 April Ln
- 7081 Georges Way
- 7095 Georges Way
- 1459 April Ln