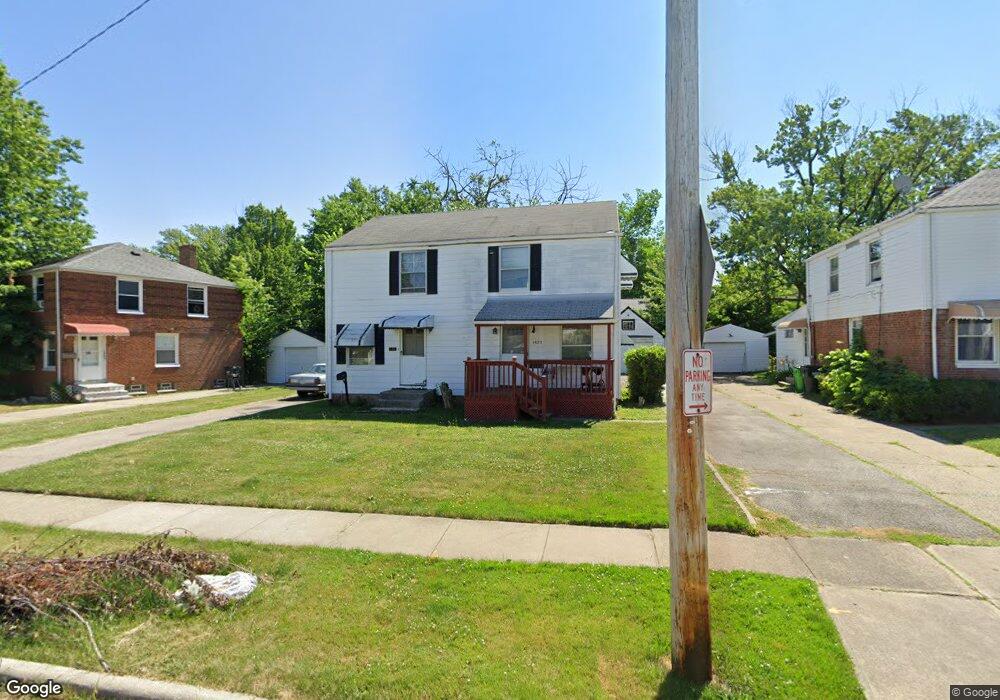
1473 E 248th St Euclid, OH 44117
Estimated Value: $63,000 - $89,000
2
Beds
1
Bath
832
Sq Ft
$86/Sq Ft
Est. Value
About This Home
This home is located at 1473 E 248th St, Euclid, OH 44117 and is currently estimated at $71,739, approximately $86 per square foot. 1473 E 248th St is a home located in Cuyahoga County with nearby schools including Bluestone Elementary School, Euclid Middle School, and Euclid High School.
Ownership History
Date
Name
Owned For
Owner Type
Purchase Details
Closed on
Sep 11, 2023
Sold by
Pnc Bank National Association
Bought by
Blasini Angelo
Current Estimated Value
Home Financials for this Owner
Home Financials are based on the most recent Mortgage that was taken out on this home.
Original Mortgage
$42,195
Interest Rate
7.18%
Mortgage Type
New Conventional
Purchase Details
Closed on
Aug 18, 2023
Sold by
Sheriff Of Cuyahoga County
Bought by
Pnc Bank National Association
Home Financials for this Owner
Home Financials are based on the most recent Mortgage that was taken out on this home.
Original Mortgage
$42,195
Interest Rate
7.18%
Mortgage Type
New Conventional
Purchase Details
Closed on
Jun 13, 1977
Sold by
Clark Clark J J and Clark G
Bought by
Lawrence Neal
Purchase Details
Closed on
Jan 1, 1975
Bought by
Clark Clark J and Clark G
Create a Home Valuation Report for This Property
The Home Valuation Report is an in-depth analysis detailing your home's value as well as a comparison with similar homes in the area
Home Values in the Area
Average Home Value in this Area
Purchase History
| Date | Buyer | Sale Price | Title Company |
|---|---|---|---|
| Blasini Angelo | $43,500 | Fast Tract Title Services | |
| Pnc Bank National Association | $36,400 | None Listed On Document | |
| Lawrence Neal | $27,000 | -- | |
| Clark Clark J | -- | -- |
Source: Public Records
Mortgage History
| Date | Status | Borrower | Loan Amount |
|---|---|---|---|
| Previous Owner | Blasini Angelo | $42,195 |
Source: Public Records
Tax History Compared to Growth
Tax History
| Year | Tax Paid | Tax Assessment Tax Assessment Total Assessment is a certain percentage of the fair market value that is determined by local assessors to be the total taxable value of land and additions on the property. | Land | Improvement |
|---|---|---|---|---|
| 2024 | $1,165 | $15,225 | $5,215 | $10,010 |
| 2023 | $1,463 | $16,110 | $4,030 | $12,080 |
| 2022 | $1,431 | $16,100 | $4,030 | $12,080 |
| 2021 | $1,584 | $16,100 | $4,030 | $12,080 |
| 2020 | $1,340 | $12,180 | $3,050 | $9,140 |
| 2019 | $1,198 | $34,800 | $8,700 | $26,100 |
| 2018 | $1,193 | $12,180 | $3,050 | $9,140 |
| 2017 | $1,268 | $10,710 | $2,520 | $8,190 |
| 2016 | $1,271 | $10,710 | $2,520 | $8,190 |
| 2015 | $1,349 | $10,710 | $2,520 | $8,190 |
| 2014 | $1,349 | $12,610 | $2,980 | $9,630 |
Source: Public Records
Map
Nearby Homes
- 1467 E 250th St
- 1468 E 252nd St
- 1498 E 248th St
- 1552 E 254th St
- 1530 E 254th St
- 25151 Euclid Ave
- 24971 Euclid Ave
- 1523 Babbitt Rd
- 1471 Hall Ct
- 1555 E 256th St
- 1445 Sulzer Ave
- 1507 E 256th St
- 24691 Hawthorne Dr
- 24690 Hawthorne Dr
- 25321 Chatworth Dr
- 1620 E 243rd St
- 145 Richmond Rd
- 1836 Braeburn Park Dr
- 1865 Idlehurst Dr
- 1823 Sunset Dr
- 1477 E 248th St
- 1477 E 248th St Unit E
- 1471 E 248th St
- 1481 E 248th St
- 1463 E 248th St
- 1483 E 248th St
- 1461 E 248th St
- 1485 E 248th St
- 1472 E 250th St
- 24830 Fisher Rd
- 1470 E 250th St
- 1474 E 250th St
- 1468 E 250th St
- 1478 E 250th St
- 1489 E 248th St
- 1464 E 250th St
- 1464 E 250th St Unit E
- 24850 Fisher Rd
- 1480 E 250th St
- 1491 E 248th St