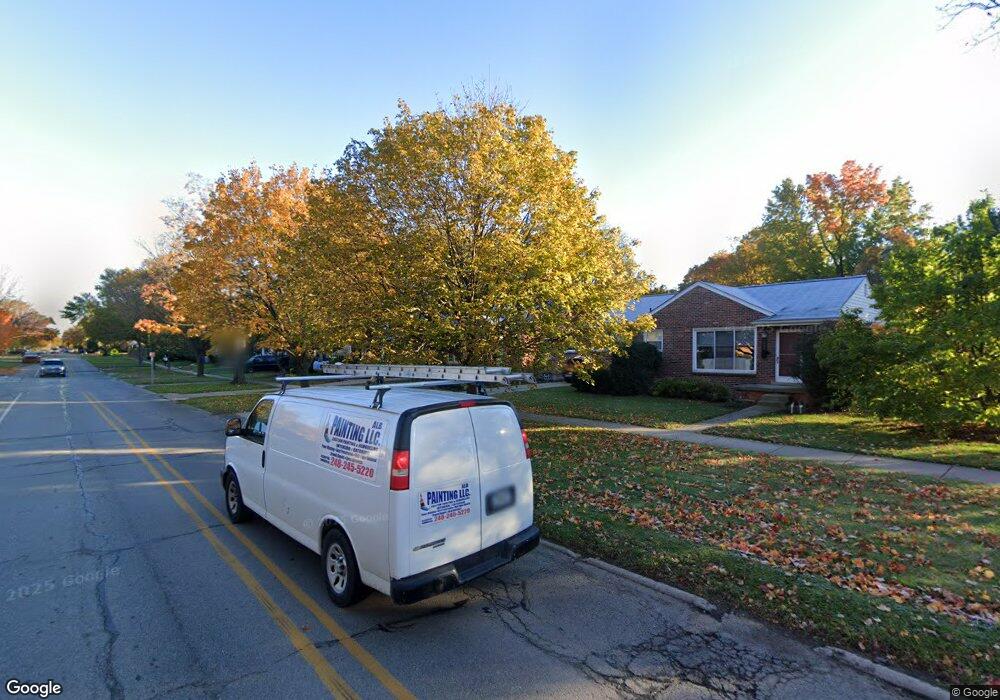
1473 S Eton St Birmingham, MI 48009
Estimated Value: $385,413 - $426,000
3
Beds
1
Bath
1,092
Sq Ft
$371/Sq Ft
Est. Value
About This Home
This home is located at 1473 S Eton St, Birmingham, MI 48009 and is currently estimated at $405,103, approximately $370 per square foot. 1473 S Eton St is a home located in Oakland County with nearby schools including Pembroke Elementary School, Derby Middle School, and Ernest W. Seaholm High School.
Ownership History
Date
Name
Owned For
Owner Type
Purchase Details
Closed on
Aug 3, 2011
Sold by
Cherry Brian and Cherry Marissa
Bought by
Hamil Dawn M
Current Estimated Value
Purchase Details
Closed on
Feb 22, 2011
Sold by
Cherry Brian A and Cherry Marissa C
Bought by
Federal National Mortgage Association
Purchase Details
Closed on
Aug 15, 2005
Sold by
Isadore Frank H and Isadore Florence W
Bought by
Cherry Brian A and Makoski Marissa C
Create a Home Valuation Report for This Property
The Home Valuation Report is an in-depth analysis detailing your home's value as well as a comparison with similar homes in the area
Home Values in the Area
Average Home Value in this Area
Purchase History
| Date | Buyer | Sale Price | Title Company |
|---|---|---|---|
| Hamil Dawn M | $90,000 | Attorneys Title Agency Llc | |
| Federal National Mortgage Association | $72,800 | None Available | |
| Cherry Brian A | $209,000 | Lawyers Title |
Source: Public Records
Tax History Compared to Growth
Tax History
| Year | Tax Paid | Tax Assessment Tax Assessment Total Assessment is a certain percentage of the fair market value that is determined by local assessors to be the total taxable value of land and additions on the property. | Land | Improvement |
|---|---|---|---|---|
| 2024 | $2,957 | $148,760 | $0 | $0 |
| 2023 | $2,833 | $139,660 | $0 | $0 |
| 2022 | $3,038 | $131,100 | $0 | $0 |
| 2021 | $3,010 | $123,440 | $0 | $0 |
| 2020 | $2,682 | $116,560 | $0 | $0 |
| 2019 | $3,035 | $108,980 | $0 | $0 |
| 2018 | $3,012 | $103,740 | $0 | $0 |
| 2017 | $3,007 | $101,580 | $0 | $0 |
| 2016 | $3,013 | $99,950 | $0 | $0 |
| 2015 | -- | $93,200 | $0 | $0 |
| 2014 | -- | $78,020 | $0 | $0 |
| 2011 | -- | $66,480 | $0 | $0 |
Source: Public Records
Map
Nearby Homes
- 2070 Sheffield Rd
- 1717 Penistone St
- 1590 Cheltenham Rd
- 1982 E Lincoln St
- 1552 Bennaville Ave
- 1963 Cole St
- 1760 Cole St
- 1458 Chapin Ave
- 000 Taunton Rd
- 1368 Bennaville Ave
- 1427 Humphrey Ave
- 1745 Webster St
- 1840 Holland St
- 1982 Haynes St
- 1268 Davis Ave
- 4423 Groveland Ave
- 4109 Grandview Rd
- 1489 Holland St
- 1135 Chapin Ave
- 1971 Bowers St
- 1455 S Eton St
- 1491 S Eton St
- 2083 Sheffield Rd
- 1431 S Eton St
- 1407 S Eton St
- 2095 Sheffield Rd
- 1494 E Melton Rd
- 1389 S Eton St Unit Bldg-Unit
- 1389 S Eton St
- 1501 Mansfield Rd
- 1348 S Eton St
- 1990 Humphrey Ave
- 1392 E Melton Rd
- 1382 S Eton St
- 1501 S Eton St
- 1456 E Melton Rd Unit Bldg-Unit
- 1456 E Melton Rd
- 1418 E Melton Rd
- 1515 Mansfield Rd
- 1363 S Eton St