14734 Perthshire Rd Unit E Houston, TX 77079
Energy Corridor NeighborhoodEstimated Value: $261,261 - $295,000
4
Beds
3
Baths
2,726
Sq Ft
$101/Sq Ft
Est. Value
About This Home
This home is located at 14734 Perthshire Rd Unit E, Houston, TX 77079 and is currently estimated at $275,815, approximately $101 per square foot. 14734 Perthshire Rd Unit E is a home located in Harris County with nearby schools including Nottingham Elementary School, Spring Forest Middle School, and Stratford High School.
Ownership History
Date
Name
Owned For
Owner Type
Purchase Details
Closed on
Jan 9, 2017
Sold by
Foote Brandon Robert and Foote Christine Nicole
Bought by
Foote Brandon Robert and Foote Christine Nicole
Current Estimated Value
Home Financials for this Owner
Home Financials are based on the most recent Mortgage that was taken out on this home.
Original Mortgage
$240,052
Outstanding Balance
$197,314
Interest Rate
4.03%
Mortgage Type
New Conventional
Estimated Equity
$78,501
Purchase Details
Closed on
Nov 26, 2007
Sold by
Ramkhelawan Rosemarie T
Bought by
Geetan Steven I
Purchase Details
Closed on
Aug 17, 2007
Sold by
Vest Vicky Ann and Mcdaniel David Alan
Bought by
Geetan Steve I and Ramkhelawan Rosemarie
Home Financials for this Owner
Home Financials are based on the most recent Mortgage that was taken out on this home.
Original Mortgage
$108,000
Interest Rate
6.64%
Mortgage Type
Purchase Money Mortgage
Create a Home Valuation Report for This Property
The Home Valuation Report is an in-depth analysis detailing your home's value as well as a comparison with similar homes in the area
Home Values in the Area
Average Home Value in this Area
Purchase History
| Date | Buyer | Sale Price | Title Company |
|---|---|---|---|
| Foote Brandon Robert | -- | None Available | |
| Geetan Steven I | -- | None Available | |
| Geetan Steve I | -- | Fidelity National Title |
Source: Public Records
Mortgage History
| Date | Status | Borrower | Loan Amount |
|---|---|---|---|
| Open | Foote Brandon Robert | $240,052 | |
| Closed | Geetan Steve I | $108,000 | |
| Closed | Geetan Steven I | $0 |
Source: Public Records
Tax History Compared to Growth
Tax History
| Year | Tax Paid | Tax Assessment Tax Assessment Total Assessment is a certain percentage of the fair market value that is determined by local assessors to be the total taxable value of land and additions on the property. | Land | Improvement |
|---|---|---|---|---|
| 2025 | $1,825 | $267,876 | $66,290 | $201,586 |
| 2024 | $1,825 | $287,426 | $66,290 | $221,136 |
| 2023 | $1,825 | $287,426 | $66,290 | $221,136 |
| 2022 | $5,552 | $250,360 | $66,290 | $184,070 |
| 2021 | $5,271 | $215,906 | $66,290 | $149,616 |
| 2020 | $5,410 | $215,906 | $66,290 | $149,616 |
| 2019 | $5,322 | $203,284 | $53,032 | $150,252 |
| 2018 | $1,140 | $216,457 | $53,032 | $163,425 |
| 2017 | $5,663 | $216,457 | $53,032 | $163,425 |
| 2016 | $4,983 | $190,482 | $53,032 | $137,450 |
| 2015 | $4,202 | $188,966 | $53,032 | $135,934 |
| 2014 | $4,202 | $157,866 | $26,516 | $131,350 |
Source: Public Records
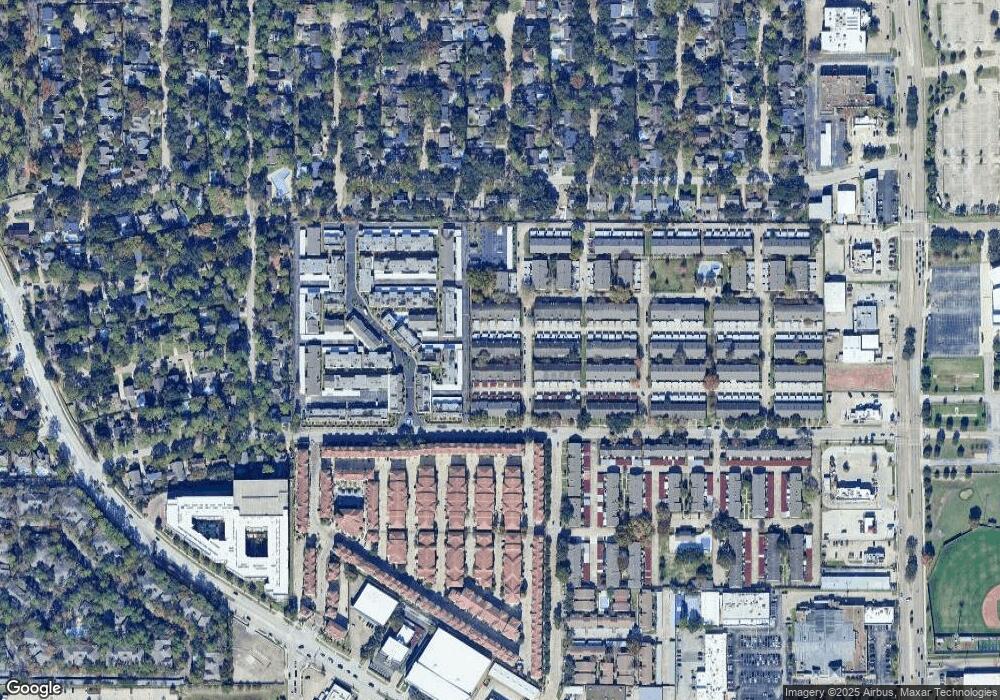
Map
Nearby Homes
- 14708 Perthshire Rd Unit F
- 14690 Perthshire Rd Unit C
- 14688 Perthshire Rd Unit C
- 14721 Perthshire Rd
- 738 Thicket Ln
- 14707 Perthshire Rd
- 14662 Perthshire Rd Unit D
- 14919 Woodthorpe Ln
- 818 Thornvine Ln
- 840 Threadneedle St Unit 181
- 840 Threadneedle St Unit 208
- 840 Threadneedle St Unit 184
- 820 Threadneedle St Unit 249
- 14719 Barryknoll Ln Unit 52
- 14711 Barryknoll Ln Unit 35
- 14703 Barryknoll Ln Unit 26
- 15066 Kimberley Ct
- 14715 Barryknoll Ln Unit 128
- 14715 Barryknoll Ln Unit 152
- 850 Threadneedle St Unit 71
- 14734 Perthshire Rd Unit 29
- 14734 Perthshire Rd Unit 29
- 14734 Perthshire Rd Unit 29
- 14734 Perthshire Rd Unit 29
- 14734 Perthshire Rd Unit 29
- 14734 Perthshire Rd Unit 29
- 14734 Perthshire Rd Unit D
- 14734 Perthshire Rd Unit C
- 14734 Perthshire Rd Unit A
- 14732 Perthshire Rd Unit 34
- 14732 Perthshire Rd Unit 34
- 14732 Perthshire Rd Unit 34
- 14732 Perthshire Rd Unit 34
- 14732 Perthshire Rd Unit 34
- 14732 Perthshire Rd Unit 34
- 14732 Perthshire Rd Unit F
- 14732 Perthshire Rd Unit D
- 14732 Perthshire Rd Unit A
- 14736 Perthshire Rd Unit C Rd Unit C
- 14736 Perthshire Rd Unit 28