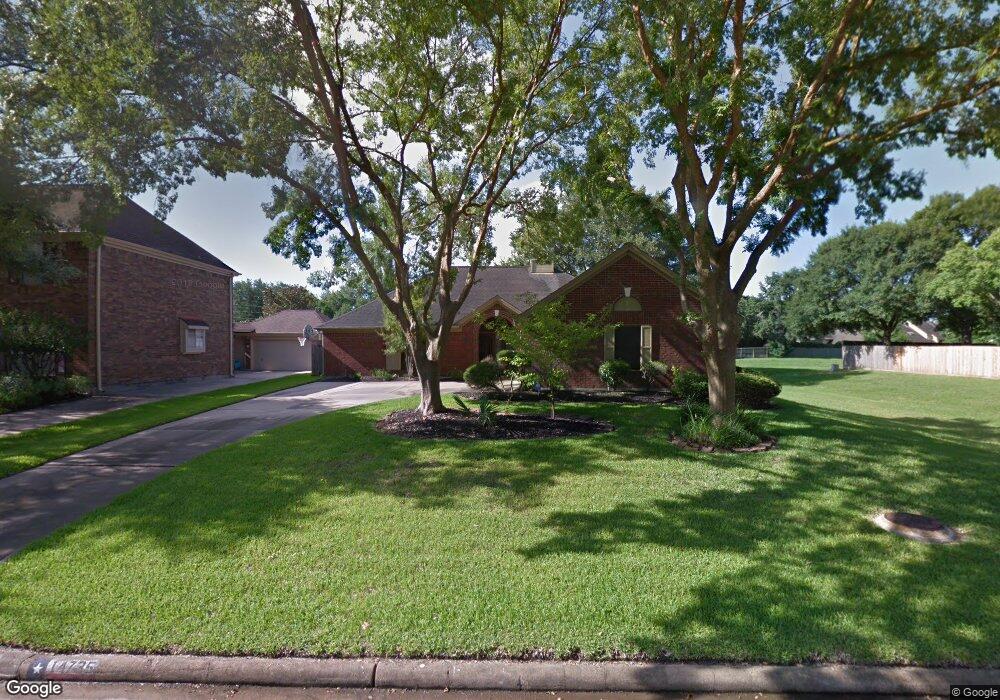
14735 Forest Trails Dr Houston, TX 77095
Copperfield NeighborhoodEstimated Value: $284,000 - $314,000
4
Beds
2
Baths
2,102
Sq Ft
$143/Sq Ft
Est. Value
About This Home
This home is located at 14735 Forest Trails Dr, Houston, TX 77095 and is currently estimated at $301,601, approximately $143 per square foot. 14735 Forest Trails Dr is a home located in Harris County with nearby schools including Owens Elementary School, Labay Middle School, and Cypress Falls High School.
Ownership History
Date
Name
Owned For
Owner Type
Purchase Details
Closed on
Apr 12, 2013
Sold by
Olsen Cheryl Jane
Bought by
Mroz Mark and Mroz Sandra
Current Estimated Value
Home Financials for this Owner
Home Financials are based on the most recent Mortgage that was taken out on this home.
Original Mortgage
$112,425
Outstanding Balance
$79,644
Interest Rate
3.55%
Mortgage Type
New Conventional
Estimated Equity
$221,957
Purchase Details
Closed on
Apr 28, 2004
Sold by
Ducharme Roger M and Ducharme Kim T
Bought by
Coffman Betty J
Purchase Details
Closed on
Nov 12, 1996
Sold by
Broussard Gerry J and Broussard Cynthia A
Bought by
Ducharme Roger M and Ducharme Kim T
Home Financials for this Owner
Home Financials are based on the most recent Mortgage that was taken out on this home.
Original Mortgage
$113,500
Interest Rate
8.05%
Create a Home Valuation Report for This Property
The Home Valuation Report is an in-depth analysis detailing your home's value as well as a comparison with similar homes in the area
Home Values in the Area
Average Home Value in this Area
Purchase History
| Date | Buyer | Sale Price | Title Company |
|---|---|---|---|
| Mroz Mark | -- | None Available | |
| Coffman Betty J | -- | Startex Title Company | |
| Ducharme Roger M | -- | Stewart Title |
Source: Public Records
Mortgage History
| Date | Status | Borrower | Loan Amount |
|---|---|---|---|
| Open | Mroz Mark | $112,425 | |
| Previous Owner | Ducharme Roger M | $113,500 |
Source: Public Records
Tax History Compared to Growth
Tax History
| Year | Tax Paid | Tax Assessment Tax Assessment Total Assessment is a certain percentage of the fair market value that is determined by local assessors to be the total taxable value of land and additions on the property. | Land | Improvement |
|---|---|---|---|---|
| 2025 | $6,269 | $263,888 | $64,285 | $199,603 |
| 2024 | $6,269 | $297,990 | $64,285 | $233,705 |
| 2023 | $6,269 | $281,143 | $64,285 | $216,858 |
| 2022 | $5,740 | $251,874 | $51,358 | $200,516 |
| 2021 | $4,875 | $203,028 | $51,358 | $151,670 |
| 2020 | $4,946 | $200,481 | $36,684 | $163,797 |
| 2019 | $4,947 | $194,159 | $27,560 | $166,599 |
| 2018 | $2,781 | $193,117 | $27,560 | $165,557 |
| 2017 | $4,936 | $193,117 | $27,560 | $165,557 |
| 2016 | $4,577 | $179,066 | $22,738 | $156,328 |
| 2015 | $4,146 | $179,066 | $22,738 | $156,328 |
| 2014 | $4,146 | $159,893 | $18,948 | $140,945 |
Source: Public Records
Map
Nearby Homes
- 8043 Oceanside Dr
- 14519 Sandalfoot St
- 14502 Sandalfoot St
- 14911 Sandalfoot St
- 14919 Forest Trails Dr
- 14931 Inverrary Dr
- 7921 Capri Cir
- 7637 Ameswood Rd
- 14419 Verde Mar Ln
- 8023 Carmel Cir
- 15010 Chetland Place Dr
- 14410 Muirfield Ln
- 7827 Alamar Dr
- 15131 New Hastings Dr
- Highway 6 N & Huffmeister Rd
- 14823 Elmont Dr
- 8303 Gros Ventre Ln
- 7618 Mauna Kai Dr
- 8315 Gros Ventre Ln
- 7315 Muirfield Valley Dr
- 14731 Forest Trails Dr
- 14803 Forest Trails Dr
- 14727 Forest Trails Dr
- 14734 Forest Trails Dr
- 14730 Forest Trails Dr
- 14723 Forest Trails Dr
- 14807 Forest Trails Dr
- 14802 Forest Trails Dr
- 14726 Forest Trails Dr
- 14806 Forest Trails Dr
- 14811 Forest Trails Dr
- 7906 Inverrary Ct
- 14719 Forest Trails Dr
- 14722 Forest Trails Dr
- 14715 Preston Park Dr
- 14711 Preston Park Dr
- 14810 Forest Trails Dr
- 14803 Preston Park Dr
- 7902 Inverrary Ct
- 7910 Inverrary Ct