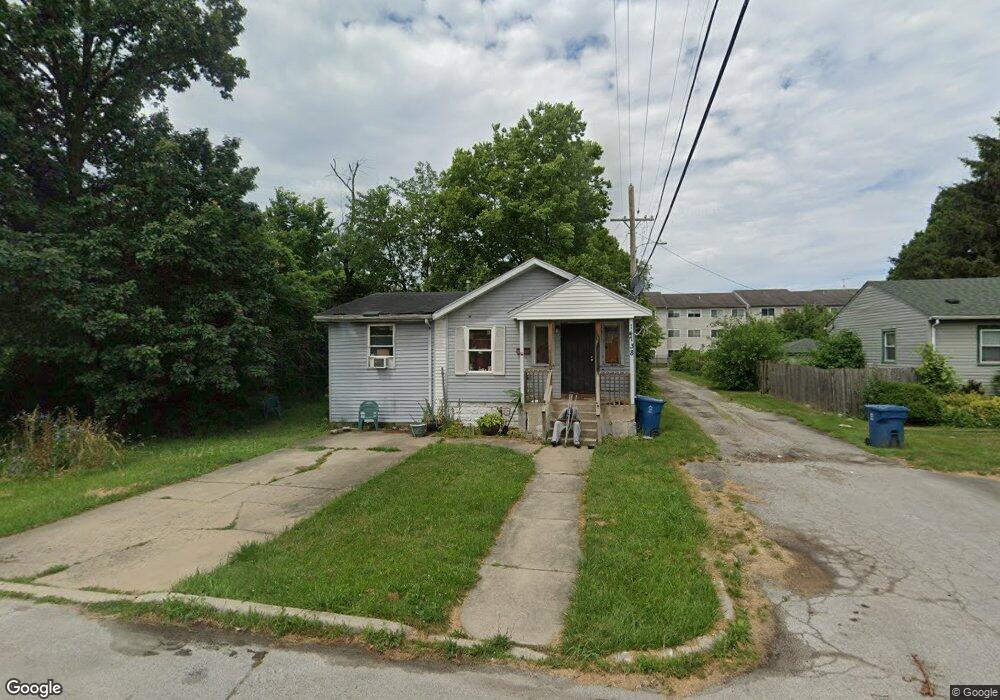
14738 Myrtle Ave Harvey, IL 60426
Estimated Value: $61,873 - $117,000
2
Beds
1
Bath
580
Sq Ft
$158/Sq Ft
Est. Value
About This Home
This home is located at 14738 Myrtle Ave, Harvey, IL 60426 and is currently estimated at $91,468, approximately $157 per square foot. 14738 Myrtle Ave is a home located in Cook County with nearby schools including Riley Early Childhood Center, Brooks Middle School, and Thornton Township High School.
Ownership History
Date
Name
Owned For
Owner Type
Purchase Details
Closed on
Oct 15, 2010
Sold by
Mayfield Saundra
Bought by
Lavigne Raymond
Current Estimated Value
Purchase Details
Closed on
Mar 28, 2000
Sold by
Ocwen Federal Bank Fsb
Bought by
Mayfield Saundra
Purchase Details
Closed on
Nov 11, 1999
Sold by
Agee Michelle
Bought by
Ocwen Federal Bank
Purchase Details
Closed on
Dec 12, 1997
Sold by
Stepp Brian A
Bought by
Agee Michelle and Staten Barbara A
Purchase Details
Closed on
May 8, 1996
Sold by
Felton Joseph and Felton Rose
Bought by
Williams Robert
Home Financials for this Owner
Home Financials are based on the most recent Mortgage that was taken out on this home.
Original Mortgage
$28,700
Interest Rate
8.95%
Purchase Details
Closed on
Jan 6, 1995
Sold by
Bamesberger William
Bought by
Felton Joseph and Felton Rose
Create a Home Valuation Report for This Property
The Home Valuation Report is an in-depth analysis detailing your home's value as well as a comparison with similar homes in the area
Home Values in the Area
Average Home Value in this Area
Purchase History
| Date | Buyer | Sale Price | Title Company |
|---|---|---|---|
| Lavigne Raymond | $6,500 | None Available | |
| Mayfield Saundra | $6,000 | -- | |
| Ocwen Federal Bank | -- | -- | |
| Agee Michelle | $45,000 | Professional National Title | |
| Williams Robert | $12,000 | -- | |
| Stepp Brian A | $41,000 | Attorneys Natl Title Network | |
| Felton Joseph | $3,000 | -- |
Source: Public Records
Mortgage History
| Date | Status | Borrower | Loan Amount |
|---|---|---|---|
| Previous Owner | Stepp Brian A | $28,700 |
Source: Public Records
Tax History Compared to Growth
Tax History
| Year | Tax Paid | Tax Assessment Tax Assessment Total Assessment is a certain percentage of the fair market value that is determined by local assessors to be the total taxable value of land and additions on the property. | Land | Improvement |
|---|---|---|---|---|
| 2024 | $1,588 | $2,429 | $859 | $1,570 |
| 2023 | $1,563 | $2,429 | $859 | $1,570 |
| 2022 | $1,563 | $1,923 | $859 | $1,064 |
| 2021 | $1,510 | $1,922 | $859 | $1,063 |
| 2020 | $1,551 | $1,922 | $859 | $1,063 |
| 2019 | $1,457 | $1,877 | $781 | $1,096 |
| 2018 | $1,421 | $1,877 | $781 | $1,096 |
| 2017 | $1,389 | $1,877 | $781 | $1,096 |
| 2016 | $1,395 | $2,155 | $703 | $1,452 |
| 2015 | $1,340 | $2,155 | $703 | $1,452 |
| 2014 | $1,336 | $2,155 | $703 | $1,452 |
| 2013 | $1,501 | $2,467 | $703 | $1,764 |
Source: Public Records
Map
Nearby Homes
- 14735 Myrtle Ave
- 14616 Loomis Ave
- 14900 Vine Ave
- 14600 Loomis Ave
- 14817 Lexington Ave
- 14540 Loomis Ave
- 14543 Myrtle Ave
- 14807 Paulina St
- 14725 Turlington Ave
- 14523 Lexington Ave
- 15018 Myrtle Ave
- 14911 Page Ave
- 14519 Harvey Ave
- 14727 Wood St
- 15025 Loomis Ave
- 14637 Center Ave
- 14622 Vincennes Rd
- 14502 Kentucky Ave
- 111 E 144th Ct
- 36 E 151st St
- 14738 Myrtle Ave
- 49 E 148th St
- 57 E 148th St
- 45 E 148th St
- 45 E 148th St
- 14732 Myrtle Ave
- 14732 Myrtle Ave
- 61 E 148th St
- 14728 Myrtle Ave
- 14728 Myrtle Ave
- 14733 Myrtle Ave
- 63 E 148th St
- 14724 Myrtle Ave
- 14724 Myrtle Ave
- 14731 Myrtle Ave
- 67 E 148th St
- 67 E 148th St
- 14729 Myrtle Ave
- 14720 Myrtle Ave
- 14720 Myrtle Ave