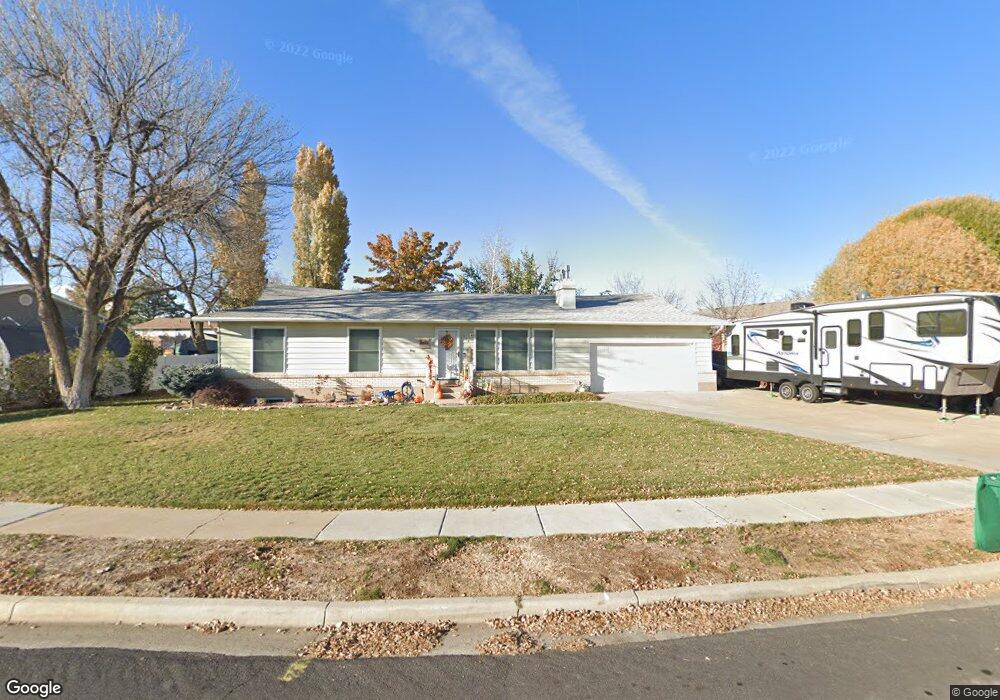
1474 W 1850 N Layton, UT 84041
Estimated Value: $452,000 - $459,000
5
Beds
3
Baths
2,340
Sq Ft
$195/Sq Ft
Est. Value
About This Home
This home is located at 1474 W 1850 N, Layton, UT 84041 and is currently estimated at $455,415, approximately $194 per square foot. 1474 W 1850 N is a home located in Davis County with nearby schools including Vae View Elementary School, North Layton Junior High School, and Northridge High School.
Ownership History
Date
Name
Owned For
Owner Type
Purchase Details
Closed on
Nov 2, 2020
Sold by
Lowe James and Lowe Brenda
Bought by
Lowe Brenda and Lowe James
Current Estimated Value
Home Financials for this Owner
Home Financials are based on the most recent Mortgage that was taken out on this home.
Original Mortgage
$232,217
Outstanding Balance
$206,545
Interest Rate
2.9%
Mortgage Type
New Conventional
Estimated Equity
$248,870
Purchase Details
Closed on
Sep 14, 2017
Sold by
Taake Carol
Bought by
Lowe James and Lowe Brenda
Purchase Details
Closed on
Jan 31, 2000
Sold by
Morse Richard O and Morse Elaine R
Bought by
Morse Richard O and Morse Elaine R
Home Financials for this Owner
Home Financials are based on the most recent Mortgage that was taken out on this home.
Original Mortgage
$52,800
Interest Rate
7.96%
Mortgage Type
Balloon
Create a Home Valuation Report for This Property
The Home Valuation Report is an in-depth analysis detailing your home's value as well as a comparison with similar homes in the area
Home Values in the Area
Average Home Value in this Area
Purchase History
| Date | Buyer | Sale Price | Title Company |
|---|---|---|---|
| Lowe Brenda | -- | Accommodation | |
| Lowe James | -- | -- | |
| Morse Richard O | -- | Bonneville Title Company Inc | |
| Morse Richard O | -- | Bonneville Title Company Inc |
Source: Public Records
Mortgage History
| Date | Status | Borrower | Loan Amount |
|---|---|---|---|
| Open | Lowe Brenda | $232,217 | |
| Previous Owner | Morse Richard O | $52,800 |
Source: Public Records
Tax History Compared to Growth
Tax History
| Year | Tax Paid | Tax Assessment Tax Assessment Total Assessment is a certain percentage of the fair market value that is determined by local assessors to be the total taxable value of land and additions on the property. | Land | Improvement |
|---|---|---|---|---|
| 2025 | -- | $235,400 | $108,083 | $127,317 |
| 2024 | -- | $230,450 | $128,957 | $101,493 |
| 2023 | $0 | $392,000 | $165,166 | $226,834 |
| 2022 | $1,538 | $226,050 | $78,130 | $147,920 |
| 2021 | $1,538 | $301,000 | $112,125 | $188,875 |
| 2020 | $1,538 | $258,000 | $83,099 | $174,901 |
| 2019 | $1,538 | $251,000 | $79,905 | $171,095 |
| 2018 | $1,538 | $219,000 | $73,987 | $145,013 |
| 2016 | $1,391 | $102,190 | $21,002 | $81,188 |
| 2015 | $1,306 | $91,080 | $21,002 | $70,078 |
| 2014 | $1,414 | $100,839 | $21,002 | $79,837 |
| 2013 | -- | $86,703 | $18,612 | $68,091 |
Source: Public Records
Map
Nearby Homes
- 1748 N 1600 W
- 1740 N 1600 W Unit 116
- 1425 W 1650 N
- 1606 W 1960 N
- 1692 N 1600 W
- 1688 N 1600 W Unit 125
- 1682 N 1600 W
- 1678 N 1600 W
- 1668 N 1600 W
- 1664 N 1600 W
- 1654 N 1600 W
- Highbridge 3 Plan at Layton Towns on Main - Townhomes
- Highbridge 1 Plan at Layton Towns on Main - Townhomes
- Midtown Plan at Layton Towns on Main - Townhomes
- Cityline 1 Plan at Layton Towns on Main - Townhomes
- Cityline 2 Plan at Layton Towns on Main - Townhomes
- 1652 N 1600 St W
- 1650 N Main St Unit 126
- 1900 N 1690 W
- 1094 N Angel St W
- 1498 W 1850 N
- 1887 N 1450 W
- 1471 W 1920 N
- 1497 Camelot Dr
- 1497 W 1920 N
- 1516 W 1850 N
- 1497 W 1850 N
- 1497 W 1850 N
- 1497 W 1850 N Unit Basement Apartment
- 1451 W 1850 N
- 1516 Camelot Dr
- 1473 W 1850 N
- 1855 W 1450 N
- 1515 W 1850 N
- 1515 W 1920 N
- 1534 W 1850 N
- 1884 N 1450 W
- 1833 N 1450 W
- 1531 W 1850 N
- 1920 N 1450 W