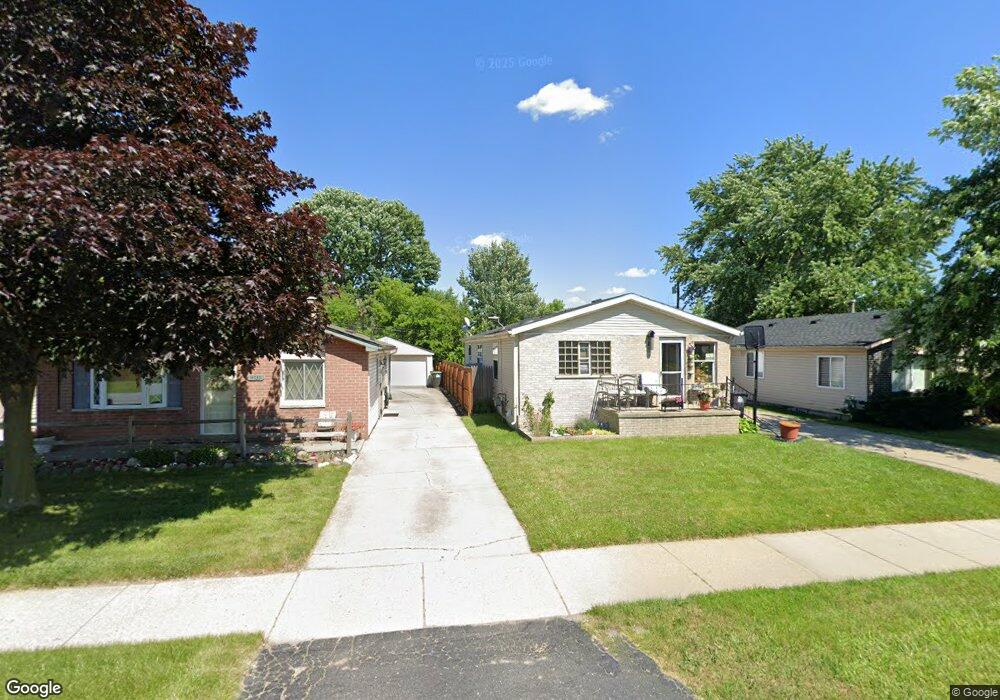
14741 Duncan St Taylor, MI 48180
Estimated Value: $162,000 - $180,162
3
Beds
2
Baths
1,196
Sq Ft
$144/Sq Ft
Est. Value
About This Home
This home is located at 14741 Duncan St, Taylor, MI 48180 and is currently estimated at $172,291, approximately $144 per square foot. 14741 Duncan St is a home located in Wayne County with nearby schools including Eureka Heights Elementary School, Hoover Middle School, and Taylor High School.
Ownership History
Date
Name
Owned For
Owner Type
Purchase Details
Closed on
Oct 15, 2013
Sold by
Architex Llc
Bought by
Architex Homes Llc
Current Estimated Value
Purchase Details
Closed on
May 15, 2007
Sold by
Hud
Bought by
Architex Llc
Purchase Details
Closed on
Jul 19, 2006
Sold by
Mortgage Electronic Registration Systems
Bought by
Aurora Loan Services Llc
Purchase Details
Closed on
May 10, 2006
Sold by
Aurora Loan Services Llc
Bought by
Hud
Purchase Details
Closed on
Feb 3, 2006
Sold by
Hud
Bought by
Mortgage Electronic Registration Systems
Purchase Details
Closed on
Nov 18, 2004
Sold by
Herr James M
Bought by
Mortgage Electronic Registration Systems
Purchase Details
Closed on
May 27, 2003
Sold by
Miller Ernest
Bought by
Herr James M
Purchase Details
Closed on
Apr 23, 2003
Sold by
City Of Taylor
Bought by
Miller Ernest
Purchase Details
Closed on
Nov 8, 2002
Sold by
Wayne County Treasurer
Bought by
City Of Taylor
Purchase Details
Closed on
Jan 20, 1999
Sold by
Sanders Diana
Bought by
Davis Crystal
Create a Home Valuation Report for This Property
The Home Valuation Report is an in-depth analysis detailing your home's value as well as a comparison with similar homes in the area
Home Values in the Area
Average Home Value in this Area
Purchase History
| Date | Buyer | Sale Price | Title Company |
|---|---|---|---|
| Architex Homes Llc | $291,551 | None Available | |
| Architex Llc | $36,000 | None Available | |
| Aurora Loan Services Llc | -- | None Available | |
| Hud | -- | None Available | |
| Mortgage Electronic Registration Systems | -- | None Available | |
| Mortgage Electronic Registration Systems | $92,721 | -- | |
| Herr James M | $90,000 | -- | |
| Miller Ernest | -- | -- | |
| City Of Taylor | $5,510 | -- | |
| Davis Crystal | -- | -- |
Source: Public Records
Tax History Compared to Growth
Tax History
| Year | Tax Paid | Tax Assessment Tax Assessment Total Assessment is a certain percentage of the fair market value that is determined by local assessors to be the total taxable value of land and additions on the property. | Land | Improvement |
|---|---|---|---|---|
| 2025 | $2,137 | $86,100 | $0 | $0 |
| 2024 | $2,137 | $77,600 | $0 | $0 |
| 2023 | $2,385 | $66,800 | $0 | $0 |
| 2022 | $2,011 | $57,900 | $0 | $0 |
| 2021 | $2,134 | $51,400 | $0 | $0 |
| 2020 | $2,110 | $47,300 | $0 | $0 |
| 2019 | $209,740 | $45,700 | $0 | $0 |
| 2018 | $1,765 | $32,400 | $0 | $0 |
| 2017 | $638 | $32,700 | $0 | $0 |
| 2016 | $2,025 | $31,800 | $0 | $0 |
| 2015 | $2,800 | $28,000 | $0 | $0 |
| 2013 | $2,810 | $29,300 | $0 | $0 |
| 2012 | $1,865 | $28,600 | $6,200 | $22,400 |
Source: Public Records
Map
Nearby Homes
- 14712 Marvin St
- 26531 Eureka Rd
- 14634 Mcguire St
- 14611 Mcguire St
- 15354 Oldham St
- 15684 Mcguire St
- 13717 Fellrath St
- 13744 Mcguire St
- 15910 Hampden St
- 13753 Mcguire St
- 15143 Siebert St
- 15350 Gulley St
- 13529 Fellrath St
- 13504 Fellrath St
- 15387 Michael St
- 15532 Wellington St
- 15679 Gulley St
- 15626 Wellington St
- 14621 New York St
- 15425 Leader St
- 14733 Duncan St
- 14757 Duncan St
- 14725 Duncan St
- 14717 Duncan St
- 14762 Harold St
- 14770 Harold St
- 14878 Harold St
- 14709 Duncan St
- 14865 Duncan St
- 14724 Harold St
- 14701 Duncan St
- 14708 Harold St Unit Bldg-Unit
- 14708 Harold St
- 14764 Duncan St
- 14892 Harold St
- 14687 Duncan St
- 14756 Duncan St
- 14696 Harold St
- 14675 Duncan St
- 14763 Harold St