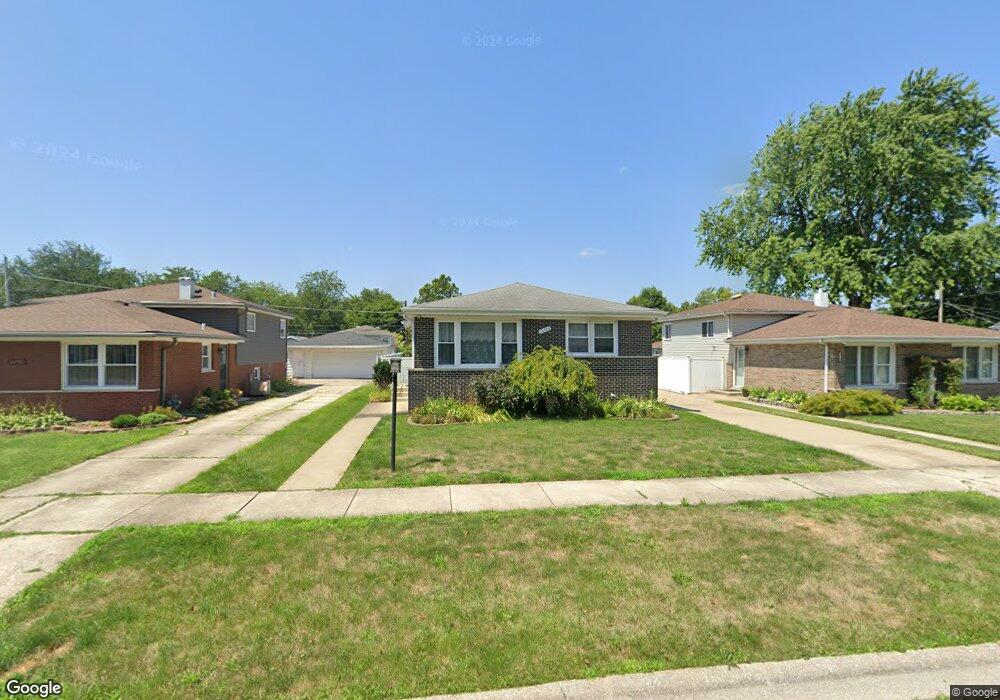
14746 Trumbull Ave Midlothian, IL 60445
Estimated Value: $148,000 - $255,000
3
Beds
2
Baths
1,277
Sq Ft
$174/Sq Ft
Est. Value
About This Home
This home is located at 14746 Trumbull Ave, Midlothian, IL 60445 and is currently estimated at $222,714, approximately $174 per square foot. 14746 Trumbull Ave is a home located in Cook County with nearby schools including Central Park Elementary School, Bremen High School, and St. Christopher School.
Ownership History
Date
Name
Owned For
Owner Type
Purchase Details
Closed on
Mar 2, 2012
Sold by
Federal National Mortgage Association
Bought by
Flis Weronika
Current Estimated Value
Purchase Details
Closed on
Aug 9, 2011
Sold by
Serna Luis E
Bought by
Federal National Mortgage Association
Purchase Details
Closed on
Oct 29, 2004
Sold by
Quirk Joseph P and Quirk Jamie N
Bought by
Serna Luis E
Home Financials for this Owner
Home Financials are based on the most recent Mortgage that was taken out on this home.
Original Mortgage
$156,655
Interest Rate
5.71%
Mortgage Type
Unknown
Purchase Details
Closed on
Jun 14, 1999
Sold by
Falborski Donald E and Falborski Carol A
Bought by
Quirk Joseph P and Quirk Jamie N
Home Financials for this Owner
Home Financials are based on the most recent Mortgage that was taken out on this home.
Original Mortgage
$106,532
Interest Rate
7.06%
Mortgage Type
FHA
Create a Home Valuation Report for This Property
The Home Valuation Report is an in-depth analysis detailing your home's value as well as a comparison with similar homes in the area
Home Values in the Area
Average Home Value in this Area
Purchase History
| Date | Buyer | Sale Price | Title Company |
|---|---|---|---|
| Flis Weronika | $60,000 | Attorneys Title Guaranty Fun | |
| Federal National Mortgage Association | -- | None Available | |
| Serna Luis E | $165,000 | Pntn | |
| Quirk Joseph P | $107,500 | Ticor Title |
Source: Public Records
Mortgage History
| Date | Status | Borrower | Loan Amount |
|---|---|---|---|
| Previous Owner | Serna Luis E | $156,655 | |
| Previous Owner | Quirk Joseph P | $106,532 |
Source: Public Records
Tax History
| Year | Tax Paid | Tax Assessment Tax Assessment Total Assessment is a certain percentage of the fair market value that is determined by local assessors to be the total taxable value of land and additions on the property. | Land | Improvement |
|---|---|---|---|---|
| 2025 | $5,179 | $17,001 | $2,328 | $14,673 |
| 2024 | $5,179 | $17,001 | $2,328 | $14,673 |
| 2023 | $4,763 | $17,001 | $2,328 | $14,673 |
| 2022 | $4,763 | $13,559 | $1,995 | $11,564 |
| 2021 | $4,620 | $13,559 | $1,995 | $11,564 |
| 2020 | $4,498 | $13,559 | $1,995 | $11,564 |
| 2019 | $4,957 | $14,843 | $1,828 | $13,015 |
| 2018 | $4,876 | $14,843 | $1,828 | $13,015 |
| 2017 | $4,725 | $14,843 | $1,828 | $13,015 |
| 2016 | $4,608 | $13,238 | $1,662 | $11,576 |
| 2015 | $4,453 | $13,238 | $1,662 | $11,576 |
| 2014 | $4,344 | $13,238 | $1,662 | $11,576 |
| 2013 | $4,557 | $15,087 | $1,662 | $13,425 |
Source: Public Records
Map
Nearby Homes
- 14832 Clifton Park Ave
- 3618 148th St
- 3625 147th St
- 3642 147th Place
- 14503 Waverly Ave
- 15031 Hamlin Ave
- 14301 Hamlin Ave
- 15112 Ridgeway Ave
- 14925 Whipple Ave
- 14904 Springfield Ave
- 14328 Lawndale Ave
- 3206 Kinne Rd
- 15115 Springfield Ave
- 15035 Harding Ave
- 3330 Roesner Dr
- 14828 S San Francisco Ave
- 14539 Crawford Ave
- 15120 Springfield Ave
- 15313 Cherry Ln
- 14544 S San Francisco Ave
- 14750 Trumbull Ave
- 14740 Trumbull Ave
- 14756 Trumbull Ave
- 14730 Trumbull Ave
- 14728 Trumbull Ave
- 14747 Saint Louis Ave
- 14741 Saint Louis Ave
- 14751 Saint Louis Ave
- 14737 Saint Louis Ave
- 14757 Saint Louis Ave
- 14731 Saint Louis Ave
- 14747 Trumbull Ave
- 14743 Trumbull Ave
- 14753 Trumbull Ave
- 14724 Trumbull Ave
- 14737 Trumbull Ave
- 14800 Trumbull Ave
- 14757 Trumbull Ave
- 14727 Saint Louis Ave
- 14733 Trumbull Ave
Your Personal Tour Guide
Ask me questions while you tour the home.