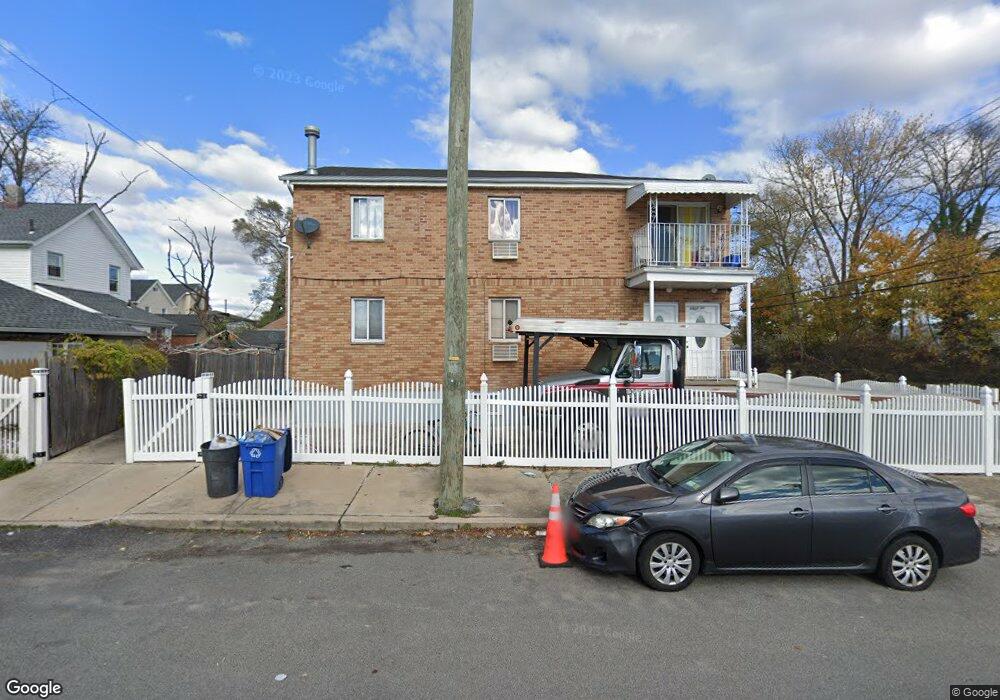
14748 Hook Creek Blvd Rosedale, NY 11422
Rosedale NeighborhoodEstimated Value: $665,796 - $980,000
--
Bed
--
Bath
1,676
Sq Ft
$503/Sq Ft
Est. Value
About This Home
This home is located at 14748 Hook Creek Blvd, Rosedale, NY 11422 and is currently estimated at $842,699, approximately $502 per square foot. 14748 Hook Creek Blvd is a home located in Queens County with nearby schools including P.S. / M.S. 138 Sunrise, Collaborative Arts Middle School, and Success Academy Charter School - Rosedale.
Ownership History
Date
Name
Owned For
Owner Type
Purchase Details
Closed on
Sep 6, 2013
Sold by
Five Development Llc
Bought by
Omidiji Toba O
Current Estimated Value
Home Financials for this Owner
Home Financials are based on the most recent Mortgage that was taken out on this home.
Original Mortgage
$493,889
Outstanding Balance
$368,847
Interest Rate
4.42%
Mortgage Type
New Conventional
Estimated Equity
$473,852
Purchase Details
Closed on
Feb 7, 2008
Sold by
Melk Llc
Bought by
Five Development Llc
Purchase Details
Closed on
Nov 5, 2007
Sold by
Bloor Holding Llc
Bought by
Melk Llc
Purchase Details
Closed on
Jul 26, 2006
Sold by
Bloor Holding Llc
Bought by
Bloor Holding Llc
Create a Home Valuation Report for This Property
The Home Valuation Report is an in-depth analysis detailing your home's value as well as a comparison with similar homes in the area
Home Values in the Area
Average Home Value in this Area
Purchase History
| Date | Buyer | Sale Price | Title Company |
|---|---|---|---|
| Omidiji Toba O | $503,000 | -- | |
| Omidiji Toba O | $503,000 | -- | |
| Five Development Llc | -- | -- | |
| Five Development Llc | -- | -- | |
| Melk Llc | -- | -- | |
| Melk Llc | -- | -- | |
| Bloor Holding Llc | -- | -- | |
| Bloor Holding Llc | -- | -- |
Source: Public Records
Mortgage History
| Date | Status | Borrower | Loan Amount |
|---|---|---|---|
| Open | Omidiji Toba O | $493,889 | |
| Closed | Omidiji Toba O | $493,889 |
Source: Public Records
Tax History Compared to Growth
Tax History
| Year | Tax Paid | Tax Assessment Tax Assessment Total Assessment is a certain percentage of the fair market value that is determined by local assessors to be the total taxable value of land and additions on the property. | Land | Improvement |
|---|---|---|---|---|
| 2025 | $5,971 | $30,536 | $5,357 | $25,179 |
| 2024 | $5,971 | $29,731 | $5,216 | $24,515 |
| 2023 | $5,818 | $28,969 | $4,872 | $24,097 |
| 2022 | $5,708 | $39,000 | $7,800 | $31,200 |
| 2021 | $5,677 | $36,480 | $7,800 | $28,680 |
| 2020 | $5,386 | $31,380 | $7,800 | $23,580 |
| 2019 | $5,183 | $34,500 | $7,800 | $26,700 |
| 2018 | $4,921 | $24,141 | $5,477 | $18,664 |
| 2017 | $4,857 | $23,826 | $5,683 | $18,143 |
| 2016 | $4,494 | $23,826 | $5,683 | $18,143 |
| 2015 | $2,711 | $21,206 | $8,260 | $12,946 |
| 2014 | $2,711 | $20,647 | $8,042 | $12,605 |
Source: Public Records
Map
Nearby Homes
- 25907 147th Rd
- 258-22 147th Rd
- 148-10 259th St Unit 82
- 25953 149th Ave
- 25827 147th Ave
- 78 Rushfield Ln
- 21 Vanderbilt Way
- 57 Southgate Rd
- 143-36 257th St
- 25946 149th Rd
- 14718 257th St
- 844 Flanders Dr
- 25701 149th Rd
- 25519 148th Ave
- 255-24 148th Ave
- 862 Fanwood Ave
- 13929 254th St
- 14963 258th St Unit 12
- 142-12 Hook Creek Blvd
- 25340 147th Ave
- 147-48 Hook Creek Blvd
- 147-48 Hook Creek Blvd Unit 1A
- 14746 Hook Creek Blvd
- 147-44 Hook Creek Blvd
- 147-32 Hook Creek Blvd
- 25937 Francis Lewis Blvd
- 259-37 Francis Lewis Blvd Unit 2
- 259-37 Francis Lewis Blvd
- 14744 Hook Creek Blvd
- 25951 Francis Lewis Blvd
- 25951 Francis Lewis Blvd
- 25955 Francis Lewis Blvd
- 14724 Hook Creek Blvd
- 25927 Francis Lewis Blvd
- 25966 147th Dr
- 14725 Hook Creek Blvd
- 259-66 147th Dr Unit 1
- 259-66 147th Dr Unit 2FL
- 259-66 147th Dr
- 14736 Hook Creek Blvd