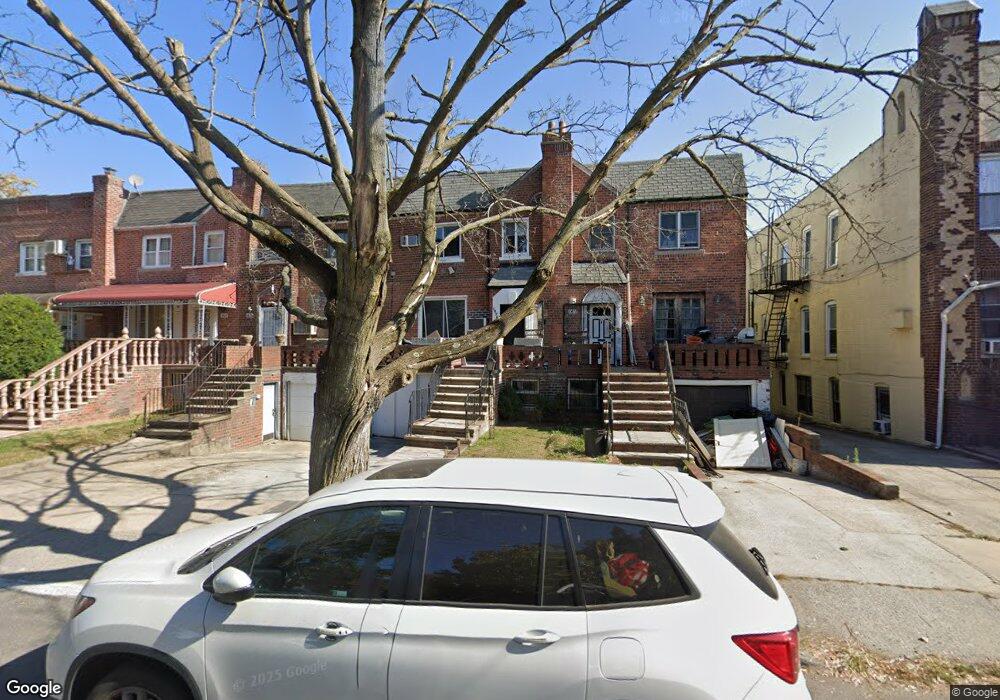
1475 E 34th St Brooklyn, NY 11234
Marine Park NeighborhoodEstimated Value: $856,000 - $998,483
Studio
--
Bath
2,116
Sq Ft
$431/Sq Ft
Est. Value
About This Home
This home is located at 1475 E 34th St, Brooklyn, NY 11234 and is currently estimated at $912,371, approximately $431 per square foot. 1475 E 34th St is a home located in Kings County with nearby schools including PS 222 Katherine R Snyder, J.H.S. 278 Marine Park, and Yeshiva Derech Hatorah.
Ownership History
Date
Name
Owned For
Owner Type
Purchase Details
Closed on
Jun 30, 2020
Sold by
Rand Alexander and Rand Aviva
Bought by
Manne Baila J
Current Estimated Value
Home Financials for this Owner
Home Financials are based on the most recent Mortgage that was taken out on this home.
Original Mortgage
$350,000
Outstanding Balance
$308,969
Interest Rate
3.1%
Mortgage Type
New Conventional
Estimated Equity
$603,402
Purchase Details
Closed on
Nov 24, 2004
Sold by
Jules Danto Trustee and The Jules Danto Revocable Trust
Bought by
Rand Alexander and Rand Aviva
Home Financials for this Owner
Home Financials are based on the most recent Mortgage that was taken out on this home.
Original Mortgage
$287,500
Interest Rate
5.63%
Mortgage Type
Purchase Money Mortgage
Purchase Details
Closed on
Jul 29, 2002
Sold by
Danto Jules
Bought by
Danto Jules and Jules Danto Revocable Tr
Purchase Details
Closed on
Jun 7, 2000
Sold by
Berkowitz Phoebe
Bought by
Danto Phoebe and Danto Jules
Create a Home Valuation Report for This Property
The Home Valuation Report is an in-depth analysis detailing your home's value as well as a comparison with similar homes in the area
Home Values in the Area
Average Home Value in this Area
Purchase History
| Date | Buyer | Sale Price | Title Company |
|---|---|---|---|
| Manne Baila J | $700,000 | -- | |
| Manne Baila J | $700,000 | -- | |
| Manne Baila J | $700,000 | -- | |
| Rand Alexander | $407,500 | -- | |
| Rand Alexander | $407,500 | -- | |
| Danto Jules | -- | -- | |
| Danto Jules | -- | -- | |
| Danto Phoebe | -- | -- | |
| Danto Phoebe | -- | -- |
Source: Public Records
Mortgage History
| Date | Status | Borrower | Loan Amount |
|---|---|---|---|
| Open | Manne Baila J | $350,000 | |
| Closed | Manne Baila J | $350,000 | |
| Previous Owner | Rand Alexander | $287,500 |
Source: Public Records
Tax History
| Year | Tax Paid | Tax Assessment Tax Assessment Total Assessment is a certain percentage of the fair market value that is determined by local assessors to be the total taxable value of land and additions on the property. | Land | Improvement |
|---|---|---|---|---|
| 2025 | $7,628 | $54,000 | $10,800 | $43,200 |
| 2024 | $7,628 | $59,640 | $10,800 | $48,840 |
| 2023 | $7,277 | $54,300 | $10,800 | $43,500 |
| 2022 | $7,153 | $43,800 | $10,800 | $33,000 |
| 2021 | $7,483 | $46,560 | $10,800 | $35,760 |
| 2020 | $3,361 | $46,500 | $10,800 | $35,700 |
| 2019 | $6,328 | $51,420 | $10,800 | $40,620 |
| 2018 | $5,789 | $29,859 | $7,974 | $21,885 |
| 2017 | $5,787 | $29,859 | $7,744 | $22,115 |
| 2016 | $5,614 | $29,631 | $10,377 | $19,254 |
| 2015 | $3,178 | $27,955 | $9,241 | $18,714 |
| 2014 | $3,178 | $26,374 | $10,163 | $16,211 |
Source: Public Records
Map
Nearby Homes
- 1443 E 35th St
- 3524 Avenue M
- 3222 Kings Hwy
- 1569 E 34th St
- 1544 E 34th St
- 3117 Kings Hwy
- 3115 Kings Hwy
- 3152 Kings Hwy
- 3626 Kings Hwy
- 3626 Kings Hwy Unit 6C
- 1344 E 35th St
- 1523 E 33rd St
- 1532 Kimball St
- 1513 Kimball St
- 3710 Avenue P
- 1345 E 38th St
- 1217 E 36th St
- 1551 E 32nd St
- 1632 E 38th St
- 1638 E 36th St
- 1475 E 34 St
- 1471 E 34th St
- 1477 E 34th St
- 1477 E 34 St
- 1469 E 34th St
- 1479 E 34th St
- 1467 E 34th St
- 1483 E 34th St
- 1483 E 34th St Unit 2
- 1485 E 34th St
- 1430 E 35th St
- 1428 E 35th St
- 1432 E 35th St
- 1426 E 35th St
- 1434 E 35th St
- 1487 E 34th St
- 1424 E 35th St
- 1436 E 35th St
- 3406 Kings Hwy
- 3410 Kings Hwy
Your Personal Tour Guide
Ask me questions while you tour the home.