Estimated Value: $522,000 - $679,000
3
Beds
3
Baths
2,282
Sq Ft
$265/Sq Ft
Est. Value
About This Home
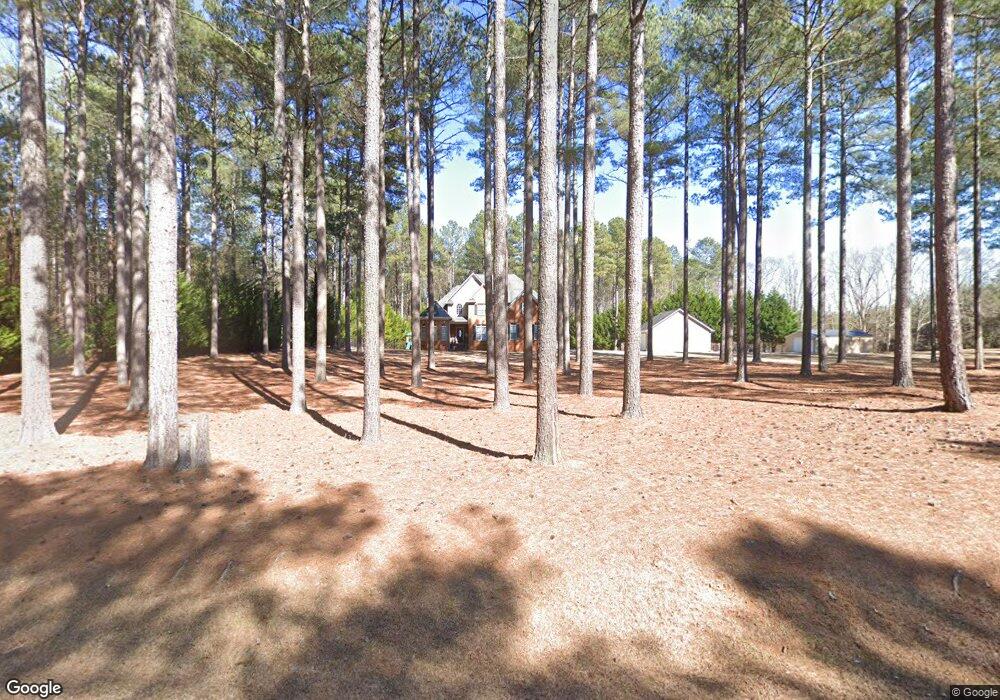
This home is located at 1475 Sims Kidd Rd, Comer, GA 30629 and is currently estimated at $604,901, approximately $265 per square foot. 1475 Sims Kidd Rd is a home located in Madison County with nearby schools including Madison County High School.
Ownership History
Date
Name
Owned For
Owner Type
Purchase Details
Closed on
Aug 28, 2020
Sold by
Drake Curtis R
Bought by
Wilburn Ryan Shane and Wilburn Kristy Erin
Current Estimated Value
Home Financials for this Owner
Home Financials are based on the most recent Mortgage that was taken out on this home.
Original Mortgage
$332,100
Outstanding Balance
$292,702
Interest Rate
2.9%
Mortgage Type
New Conventional
Estimated Equity
$312,199
Purchase Details
Closed on
Nov 18, 2005
Sold by
Bailey Barry
Bought by
Krc Development Inc
Purchase Details
Closed on
Oct 24, 2005
Sold by
Bailey Barry
Bought by
Drake Curtis R and Drake Paula H
Purchase Details
Closed on
Nov 15, 2004
Sold by
Bailey Barry
Bought by
Bailey Barry
Purchase Details
Closed on
Sep 23, 2004
Sold by
Aiken/Pike Holdings Inc
Bought by
Bailey Barry
Create a Home Valuation Report for This Property
The Home Valuation Report is an in-depth analysis detailing your home's value as well as a comparison with similar homes in the area
Purchase History
| Date | Buyer | Sale Price | Title Company |
|---|---|---|---|
| Wilburn Ryan Shane | $369,000 | -- | |
| Krc Development Inc | $28,000 | -- | |
| Drake Curtis R | $51,000 | -- | |
| Bailey Barry | -- | -- | |
| Bailey Barry | $69,600 | -- |
Source: Public Records
Mortgage History
| Date | Status | Borrower | Loan Amount |
|---|---|---|---|
| Open | Wilburn Ryan Shane | $332,100 |
Source: Public Records
Tax History
| Year | Tax Paid | Tax Assessment Tax Assessment Total Assessment is a certain percentage of the fair market value that is determined by local assessors to be the total taxable value of land and additions on the property. | Land | Improvement |
|---|---|---|---|---|
| 2025 | $5,957 | $234,463 | $35,136 | $199,327 |
| 2024 | $58 | $228,566 | $35,136 | $193,430 |
| 2023 | $6,444 | $211,098 | $29,280 | $181,818 |
| 2022 | $4,915 | $178,179 | $20,130 | $158,049 |
| 2021 | $4,217 | $138,145 | $20,130 | $118,015 |
| 2020 | $3,551 | $117,510 | $17,202 | $100,308 |
| 2019 | $3,386 | $110,887 | $14,640 | $96,247 |
| 2018 | $3,396 | $110,887 | $14,640 | $96,247 |
| 2017 | $3,193 | $110,887 | $14,640 | $96,247 |
| 2016 | $2,376 | $96,449 | $14,640 | $81,809 |
| 2015 | $2,374 | $96,449 | $14,640 | $81,809 |
| 2014 | $2,488 | $99,932 | $14,627 | $85,305 |
| 2013 | -- | $99,932 | $14,627 | $85,305 |
Source: Public Records
Map
Nearby Homes
- 109 Mill Run
- 1360 Hill St
- 0 Clairmont Ave Unit 10700774
- 2987 Georgia 72
- 113 Sidetrack Cir
- 540 Sunset Ave
- 3614 Georgia 72
- 2975 Georgia 72
- 79 Gholston St
- 54 Dove Power Rd
- 12 Laurel Ave
- 130 Shannons Place
- 549 Gholston St
- 10 Shannons Ln
- 2633 Paoli St Unit TRACT 1
- 2665 Paoli St Unit TRACT 3
- 70 Shannons Ct
- 88 S Railroad Ave
- 640 Gholston St
- 116 Scarlett Oak Ln
- 1391 Sims Kidd Rd
- 1354 Sims Kidd Rd
- 1281 Sims Kidd Rd
- 1191 Sims Kidd Rd
- 1129 Sims Kidd Rd
- 1291 Sims Kidd Rd
- 789 Cooper Rd
- 539 Sims Kidd Rd
- 2225 Sims Kidd Rd
- 926 Cooper Rd
- 2254 Sims Kidd Rd
- 522 Sims Kidd Rd
- 2349 Sims Kidd Rd
- 616 Cooper Rd
- 515 Cooper Rd
- 2346 Sims Kidd Rd
- 775 Sims Kidd Rd
- 1186 Sims Kidd Rd
- 1186 Sims Kidd Rd Unit SIMS KIDD RD
- 2601 Sims Kidd Rd
Your Personal Tour Guide
Ask me questions while you tour the home.