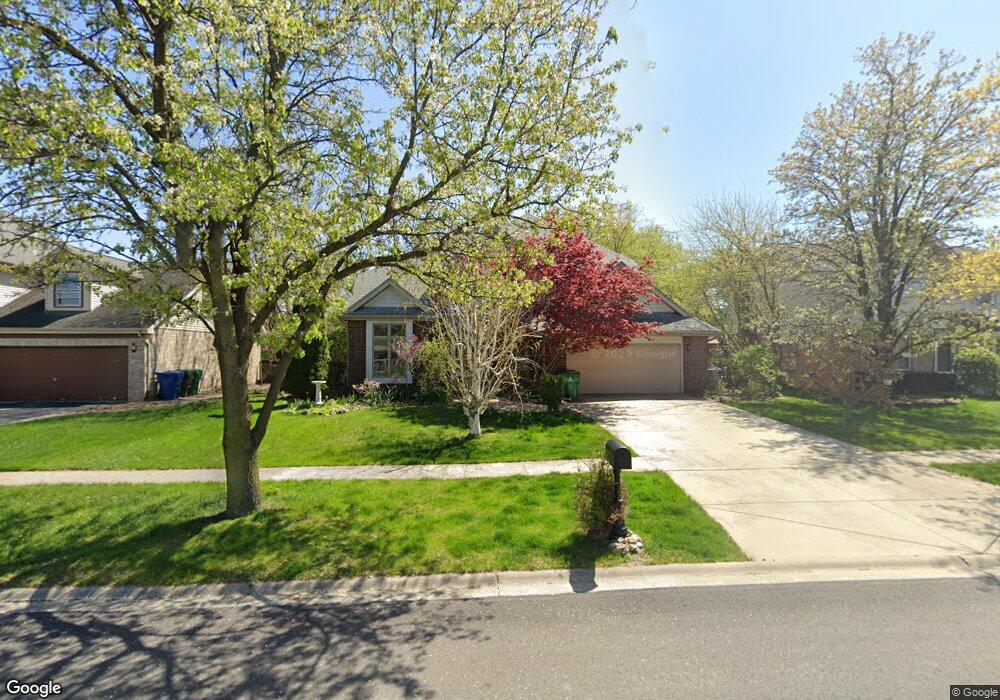
14755 Eagle Ridge Dr Homer Glen, IL 60491
Estimated Value: $434,409 - $551,000
--
Bed
--
Bath
2,212
Sq Ft
$232/Sq Ft
Est. Value
About This Home
This home is located at 14755 Eagle Ridge Dr, Homer Glen, IL 60491 and is currently estimated at $513,352, approximately $232 per square foot. 14755 Eagle Ridge Dr is a home located in Will County with nearby schools including Reed Elementary School, Walsh Elementary School, and Ludwig Elementary School.
Ownership History
Date
Name
Owned For
Owner Type
Purchase Details
Closed on
Aug 24, 2021
Sold by
Rimkus William A and Rimkus Rebekah
Bought by
Rimkus William Allen and William Allen Rimkus Trust
Current Estimated Value
Purchase Details
Closed on
Jul 25, 1997
Sold by
Beverly Trust Company
Bought by
Rimkus William A and Rimkus Rebekah R
Home Financials for this Owner
Home Financials are based on the most recent Mortgage that was taken out on this home.
Original Mortgage
$140,000
Outstanding Balance
$20,437
Interest Rate
7.71%
Mortgage Type
Purchase Money Mortgage
Estimated Equity
$492,915
Purchase Details
Closed on
Aug 11, 1995
Sold by
Brew George F
Bought by
Beverly Trust Company
Home Financials for this Owner
Home Financials are based on the most recent Mortgage that was taken out on this home.
Original Mortgage
$172,500
Interest Rate
8%
Mortgage Type
Purchase Money Mortgage
Create a Home Valuation Report for This Property
The Home Valuation Report is an in-depth analysis detailing your home's value as well as a comparison with similar homes in the area
Home Values in the Area
Average Home Value in this Area
Purchase History
| Date | Buyer | Sale Price | Title Company |
|---|---|---|---|
| Rimkus William Allen | -- | Attorney | |
| Rimkus William A | $233,000 | Premier Title Company | |
| Beverly Trust Company | -- | Chicago Title Insurance Co |
Source: Public Records
Mortgage History
| Date | Status | Borrower | Loan Amount |
|---|---|---|---|
| Open | Rimkus William A | $140,000 | |
| Previous Owner | Beverly Trust Company | $172,500 |
Source: Public Records
Tax History Compared to Growth
Tax History
| Year | Tax Paid | Tax Assessment Tax Assessment Total Assessment is a certain percentage of the fair market value that is determined by local assessors to be the total taxable value of land and additions on the property. | Land | Improvement |
|---|---|---|---|---|
| 2024 | $5,752 | $152,425 | $30,761 | $121,664 |
| 2023 | $5,752 | $138,166 | $27,883 | $110,283 |
| 2022 | $6,435 | $129,007 | $26,035 | $102,972 |
| 2021 | $6,468 | $122,224 | $24,666 | $97,558 |
| 2020 | $6,722 | $117,726 | $23,758 | $93,968 |
| 2019 | $6,639 | $113,252 | $22,855 | $90,397 |
| 2018 | $6,710 | $109,350 | $22,593 | $86,757 |
| 2017 | $6,614 | $106,289 | $21,961 | $84,328 |
| 2016 | $6,704 | $102,745 | $21,229 | $81,516 |
| 2015 | $7,147 | $98,888 | $20,432 | $78,456 |
| 2014 | $7,147 | $96,845 | $20,010 | $76,835 |
| 2013 | $7,147 | $96,845 | $20,010 | $76,835 |
Source: Public Records
Map
Nearby Homes
- 13766 W Deervalley Dr
- 13743 W Carefree Dr
- 14653 S Cricketwood Ct Unit 3
- 13734 W Birchwood Dr
- 14420 S Elizabeth Ln
- 12808 W Timberlane Ct
- 14344 Dixon Ln
- 15430 Sulky Dr
- 14459 Gatses Ln
- 13226 Farm View St
- 13521 W Catawba Ln
- 14761 Marilynn Ln
- 13408 W Catawba Ln
- 13116 Woodland Dr
- 14848 W Ginger Ln
- 13952 S Oak Ridge Dr
- 13750 W 159th St
- 0 W 159th St
- 12362 W 159th St
- 17645 S Parker Rd
- 14759 Eagle Ridge Dr
- 14751 Eagle Ridge Dr
- 14763 Eagle Ridge Dr
- 13850 Cantigny Ln
- 13842 Cantigny Ln
- 13858 Cantigny Ln
- 14802 Greenbrier Ln
- 14810 Greenbrier Ln
- 13864 Cantigny Ln
- 14801 S Eagle Ridge Dr
- 14801 Eagle Ridge Dr
- 14818 Greenbrier Ln
- 14754 Eagle Ridge Dr
- 14750 Eagle Ridge Dr
- 14758 Eagle Ridge Dr
- 14752 Greenbrier Ln
- 13906 Cantigny Ln
- 13834 Cantigny Ln
- 14762 Eagle Ridge Dr
- 14807 Eagle Ridge Dr