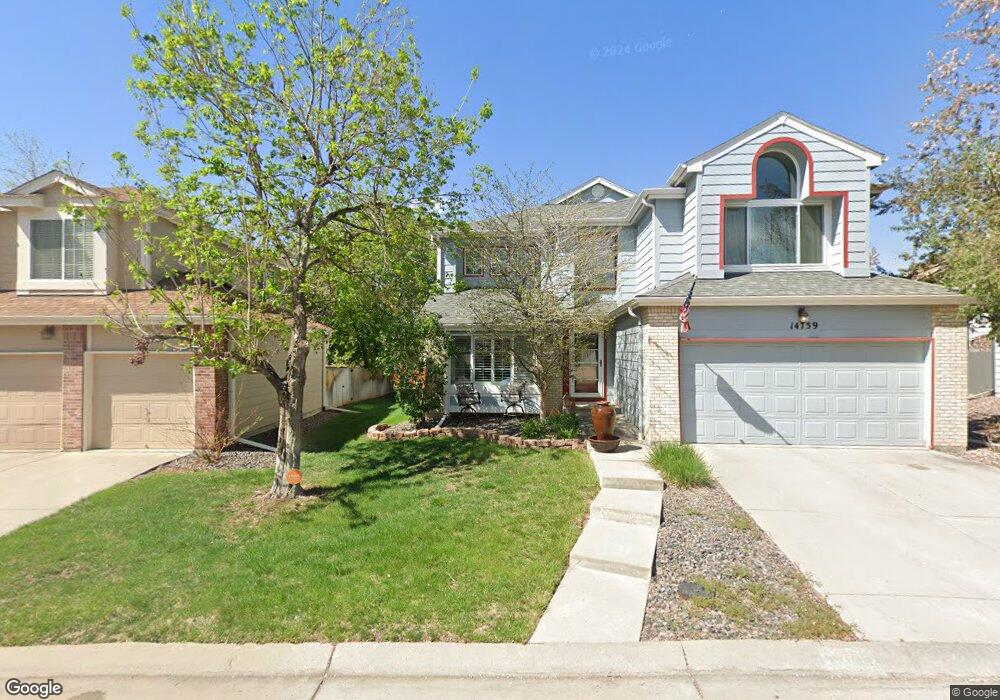
14759 E Chenango Place Aurora, CO 80015
Woodgate NeighborhoodEstimated Value: $536,000 - $582,000
3
Beds
4
Baths
2,143
Sq Ft
$256/Sq Ft
Est. Value
About This Home
This home is located at 14759 E Chenango Place, Aurora, CO 80015 and is currently estimated at $549,559, approximately $256 per square foot. 14759 E Chenango Place is a home located in Arapahoe County with nearby schools including Sagebrush Elementary School, Laredo Middle School, and Smoky Hill High School.
Ownership History
Date
Name
Owned For
Owner Type
Purchase Details
Closed on
Mar 15, 2002
Sold by
Tyler Steven L and Tyler Linda K
Bought by
Watkins W Daniel and Watkins Roberta R
Current Estimated Value
Home Financials for this Owner
Home Financials are based on the most recent Mortgage that was taken out on this home.
Original Mortgage
$192,000
Outstanding Balance
$76,694
Interest Rate
6.87%
Estimated Equity
$472,865
Purchase Details
Closed on
Apr 30, 1993
Sold by
Richmond American Homes Of Colorado Inc
Bought by
Tyler Linda K Tyler Steven L
Purchase Details
Closed on
Dec 29, 1989
Sold by
Richmond American Homes Of Colorado Ii
Bought by
Richmond American Homes Of Colorado Inc
Create a Home Valuation Report for This Property
The Home Valuation Report is an in-depth analysis detailing your home's value as well as a comparison with similar homes in the area
Home Values in the Area
Average Home Value in this Area
Purchase History
| Date | Buyer | Sale Price | Title Company |
|---|---|---|---|
| Watkins W Daniel | $240,000 | Title Services | |
| Tyler Linda K Tyler Steven L | -- | -- | |
| Richmond American Homes Of Colorado Inc | -- | -- | |
| Richmond American Homes Of Colorado Ii | -- | -- | |
| Conversion Arapco | -- | -- |
Source: Public Records
Mortgage History
| Date | Status | Borrower | Loan Amount |
|---|---|---|---|
| Open | Watkins W Daniel | $192,000 |
Source: Public Records
Tax History
| Year | Tax Paid | Tax Assessment Tax Assessment Total Assessment is a certain percentage of the fair market value that is determined by local assessors to be the total taxable value of land and additions on the property. | Land | Improvement |
|---|---|---|---|---|
| 2025 | $2,851 | $35,550 | -- | -- |
| 2024 | $2,851 | $36,140 | -- | -- |
| 2023 | $2,516 | $36,140 | $0 | $0 |
| 2022 | $2,031 | $27,849 | $0 | $0 |
| 2021 | $2,044 | $27,849 | $0 | $0 |
| 2020 | $2,141 | $29,622 | $0 | $0 |
| 2019 | $2,066 | $29,622 | $0 | $0 |
| 2018 | $1,876 | $25,286 | $0 | $0 |
| 2017 | $1,849 | $25,286 | $0 | $0 |
| 2016 | $1,609 | $20,640 | $0 | $0 |
| 2015 | $1,531 | $20,640 | $0 | $0 |
| 2014 | $1,444 | $17,241 | $0 | $0 |
| 2013 | -- | $18,080 | $0 | $0 |
Source: Public Records
Map
Nearby Homes
- 14739 E Wagontrail Place
- 14524 E Wagontrail Place
- 14503 E Wagontrail Dr
- 4973 S Dillon St Unit 135
- 14640 E Penwood Place
- 4864 S Crystal St
- 14297 E Grand Dr Unit 182
- 4853 S Crystal St
- 4694 S Crystal Way Unit D111
- 4852 S Carson St
- 4943 S Carson St Unit 207
- 14358 E Pimlico Place Unit A125
- 14782 E Belleview Ave
- 4656 S Dillon Ct Unit D
- 4586 S Fraser Way
- 4665 S Dillon Ct Unit B
- 14120 E Temple Dr Unit Y04
- 4663 S Fraser Ct Unit E
- 14933 E Belleview Dr
- 14100 E Temple Dr Unit 5
- 14739 E Chenango Place
- 14779 E Chenango Place
- 4844 S Eagle Cir
- 4834 S Eagle Cir
- 4854 S Eagle Cir
- 4824 S Eagle Cir
- 14799 E Chenango Place
- 14770 E Chenango Place
- 14760 E Chenango Place
- 4926 S Eagle Cir
- 14750 E Chenango Place
- 14740 E Chenango Place
- 4906 S Eagle Cir
- 14730 E Chenango Place
- 4814 S Eagle Cir
- 14720 E Chenango Place
- 4843 S Eagle Cir
- 14710 E Chenango Place
- 4833 S Eagle Cir
- 4804 S Eagle Cir
Your Personal Tour Guide
Ask me questions while you tour the home.