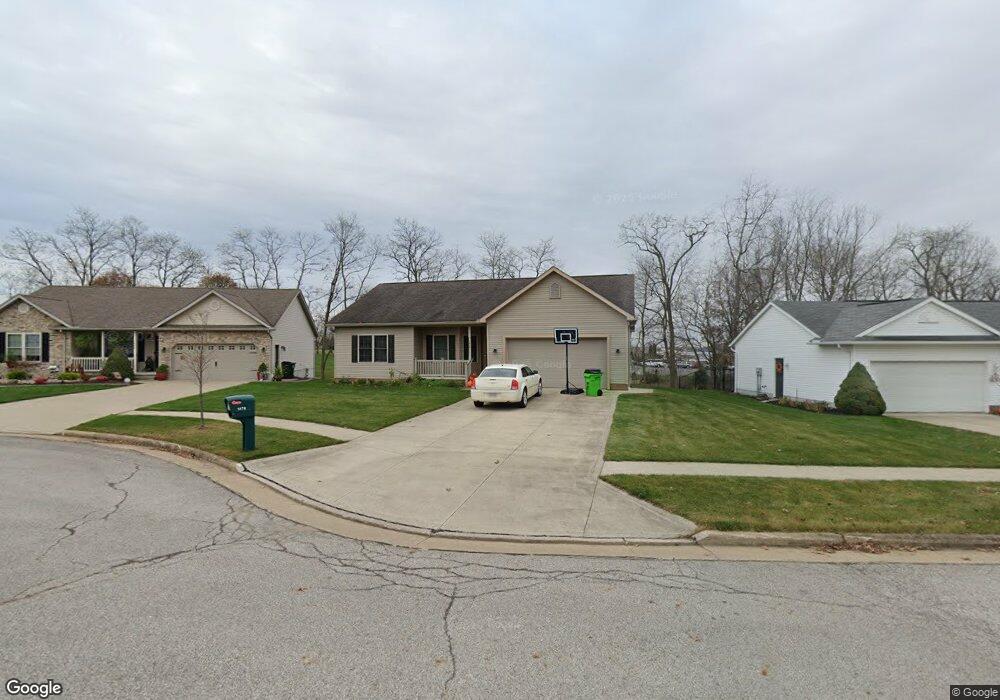
1478 Crosswind Ct Wooster, OH 44691
Estimated Value: $273,154 - $321,000
4
Beds
2
Baths
1,380
Sq Ft
$217/Sq Ft
Est. Value
About This Home
This home is located at 1478 Crosswind Ct, Wooster, OH 44691 and is currently estimated at $299,789, approximately $217 per square foot. 1478 Crosswind Ct is a home located in Wayne County with nearby schools including Parkview Elementary School, Edgewood Middle School, and Wooster High School.
Ownership History
Date
Name
Owned For
Owner Type
Purchase Details
Closed on
Feb 18, 2021
Sold by
Stone Church Properties Llc
Bought by
Graser Jaime C
Current Estimated Value
Home Financials for this Owner
Home Financials are based on the most recent Mortgage that was taken out on this home.
Original Mortgage
$179,200
Outstanding Balance
$160,275
Interest Rate
2.7%
Mortgage Type
New Conventional
Estimated Equity
$139,514
Purchase Details
Closed on
Sep 16, 2020
Sold by
Hall Charles R and Hall Anka M
Bought by
Stone Church Properties Llc
Purchase Details
Closed on
Jul 2, 2007
Sold by
Md Custom Builders Ltd
Bought by
Hall Anka M and Hall Charles R
Purchase Details
Closed on
Nov 15, 2005
Sold by
Hills & Dales Inc
Bought by
Md Custom Builders Ltd
Create a Home Valuation Report for This Property
The Home Valuation Report is an in-depth analysis detailing your home's value as well as a comparison with similar homes in the area
Home Values in the Area
Average Home Value in this Area
Purchase History
| Date | Buyer | Sale Price | Title Company |
|---|---|---|---|
| Graser Jaime C | $224,000 | Nova Title Agency Inc | |
| Stone Church Properties Llc | $175,000 | Nova Title Agency | |
| Hall Anka M | $29,000 | None Available | |
| Md Custom Builders Ltd | $28,000 | -- |
Source: Public Records
Mortgage History
| Date | Status | Borrower | Loan Amount |
|---|---|---|---|
| Open | Graser Jaime C | $179,200 |
Source: Public Records
Tax History Compared to Growth
Tax History
| Year | Tax Paid | Tax Assessment Tax Assessment Total Assessment is a certain percentage of the fair market value that is determined by local assessors to be the total taxable value of land and additions on the property. | Land | Improvement |
|---|---|---|---|---|
| 2024 | $2,983 | $70,240 | $13,560 | $56,680 |
| 2023 | $2,983 | $70,240 | $13,560 | $56,680 |
| 2022 | $2,882 | $54,030 | $10,430 | $43,600 |
| 2021 | $2,971 | $54,030 | $10,430 | $43,600 |
| 2020 | $2,308 | $54,030 | $10,430 | $43,600 |
| 2019 | $2,358 | $53,190 | $10,440 | $42,750 |
| 2018 | $2,365 | $53,190 | $10,440 | $42,750 |
| 2017 | $2,351 | $53,190 | $10,440 | $42,750 |
| 2016 | $2,319 | $49,090 | $10,040 | $39,050 |
| 2015 | $2,277 | $49,090 | $10,040 | $39,050 |
| 2014 | $2,278 | $49,090 | $10,040 | $39,050 |
| 2013 | $2,297 | $48,970 | $10,790 | $38,180 |
Source: Public Records
Map
Nearby Homes
- 2360 Star Dr
- 2457 Barrington Way Unit 331
- 2457 Barrington Way Unit 327
- 2457 Barrington Way Unit 325
- 2417 Mechanicsburg Rd
- 2447 Wetherington Ln Unit 131
- 2447 Wetherington Ln Unit 130
- 2447 Wetherington Ln
- 2520 Barrington Way Unit 529
- 2194 Ryan Ct
- 1011 Brooke Way
- 1100 Nelson Ave
- 2290 Linwood Ct
- 1951 Saddle Brook Cir Unit 1951
- 941 Woodmere Dr
- 1960 Autumn Run
- 2143 Canterbury Ln
- 2117 Canterbury Ln
- 629 Meadow Ln
- 596 Meadow Ln
- 1496 Crosswind Ct
- 1466 Crosswind Ct
- 1516 Crosswind Ct
- 1456 Crosswind Ct
- 1477 Crosswind Ct
- 1534 Crosswind Ct
- 1495 Crosswind Ct
- 1455 Crosswind Ct
- 1465 Crosswind Ct
- 1552 Crosswind Ct
- 1533 Crosswind Ct
- 2306 V L Treks End Dr
- 1551 Crosswind Ct
- 2306 Star Dr
- 1574 Crosswind Ct
- 1500 W Highland Ave
- 1520 W Highland Ave
- 1569 Crosswind Ct
- 1540 W Highland Ave
- 1480 W Highland Ave