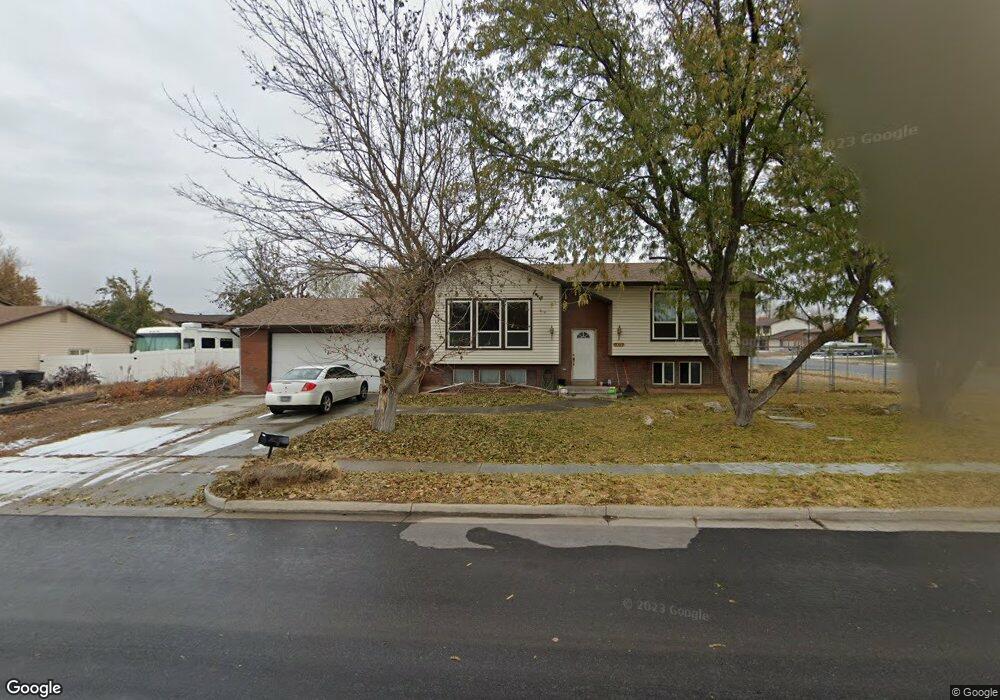
1478 N 630 W Clearfield, UT 84015
Estimated Value: $442,000 - $462,000
4
Beds
2
Baths
1,129
Sq Ft
$400/Sq Ft
Est. Value
About This Home
This home is located at 1478 N 630 W, Clearfield, UT 84015 and is currently estimated at $451,829, approximately $400 per square foot. 1478 N 630 W is a home located in Davis County with nearby schools including Sunset School, Sunset Junior High School, and Clearfield High School.
Ownership History
Date
Name
Owned For
Owner Type
Purchase Details
Closed on
Jan 13, 2012
Sold by
Richardson Ian G
Bought by
Richardson Ian G
Current Estimated Value
Home Financials for this Owner
Home Financials are based on the most recent Mortgage that was taken out on this home.
Original Mortgage
$101,342
Outstanding Balance
$68,891
Interest Rate
3.88%
Mortgage Type
VA
Estimated Equity
$382,938
Purchase Details
Closed on
Nov 3, 1998
Sold by
Allen Gary Dee and Allen Janean Y
Bought by
Richardson Ian G
Home Financials for this Owner
Home Financials are based on the most recent Mortgage that was taken out on this home.
Original Mortgage
$119,000
Interest Rate
6.61%
Mortgage Type
VA
Purchase Details
Closed on
May 22, 1998
Sold by
Lewis Michael R
Bought by
Allen Gary Dee and Allen Janean Y
Home Financials for this Owner
Home Financials are based on the most recent Mortgage that was taken out on this home.
Original Mortgage
$99,000
Interest Rate
7.13%
Create a Home Valuation Report for This Property
The Home Valuation Report is an in-depth analysis detailing your home's value as well as a comparison with similar homes in the area
Home Values in the Area
Average Home Value in this Area
Purchase History
| Date | Buyer | Sale Price | Title Company |
|---|---|---|---|
| Richardson Ian G | -- | Lsi Title Agency Inc | |
| Richardson Ian G | -- | Associated Title Company | |
| Allen Gary Dee | -- | First American Title Co |
Source: Public Records
Mortgage History
| Date | Status | Borrower | Loan Amount |
|---|---|---|---|
| Open | Richardson Ian G | $101,342 | |
| Closed | Richardson Ian G | $119,000 | |
| Previous Owner | Allen Gary Dee | $99,000 |
Source: Public Records
Tax History Compared to Growth
Tax History
| Year | Tax Paid | Tax Assessment Tax Assessment Total Assessment is a certain percentage of the fair market value that is determined by local assessors to be the total taxable value of land and additions on the property. | Land | Improvement |
|---|---|---|---|---|
| 2025 | $2,305 | $221,650 | $87,570 | $134,080 |
| 2024 | $2,253 | $217,800 | $96,078 | $121,722 |
| 2023 | $1,996 | $357,000 | $109,628 | $247,372 |
| 2022 | $2,135 | $211,200 | $66,676 | $144,524 |
| 2021 | $1,983 | $291,000 | $84,119 | $206,881 |
| 2020 | $708 | $251,000 | $71,823 | $179,177 |
| 2019 | $687 | $243,000 | $83,291 | $159,709 |
| 2018 | $538 | $217,000 | $70,268 | $146,732 |
| 2016 | $351 | $101,255 | $27,435 | $73,820 |
| 2015 | $1,313 | $89,870 | $27,435 | $62,435 |
| 2014 | $203 | $88,569 | $27,435 | $61,134 |
| 2013 | -- | $80,381 | $25,230 | $55,151 |
Source: Public Records
Map
Nearby Homes