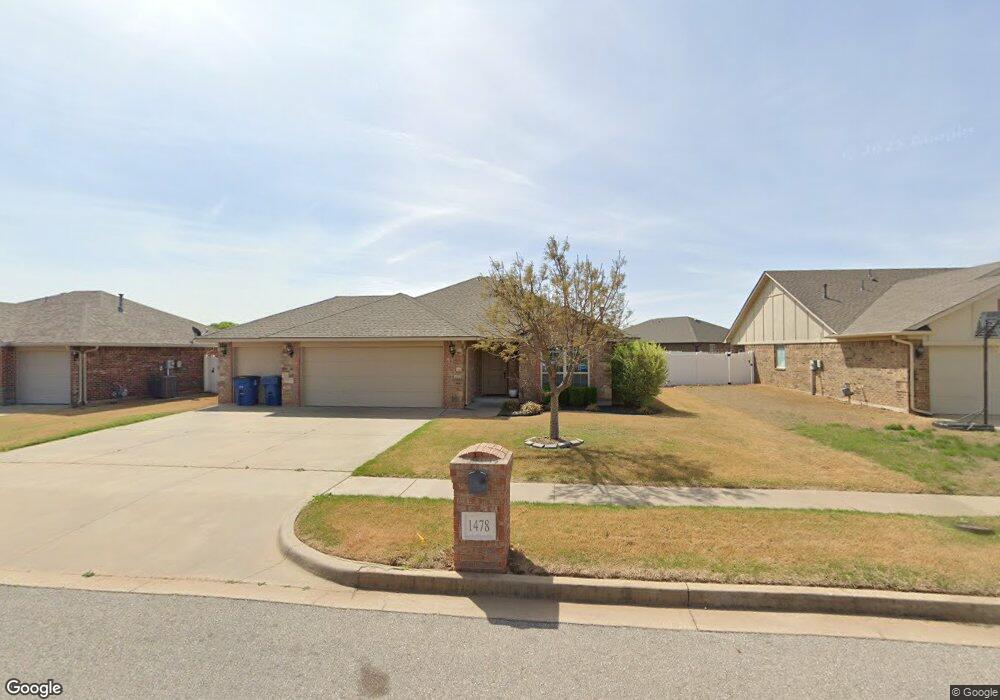
1478 SE 16th Place Newcastle, OK 73065
Estimated Value: $265,000 - $280,796
3
Beds
2
Baths
1,784
Sq Ft
$153/Sq Ft
Est. Value
About This Home
This home is located at 1478 SE 16th Place, Newcastle, OK 73065 and is currently estimated at $272,699, approximately $152 per square foot. 1478 SE 16th Place is a home with nearby schools including Newcastle Elementary School, Newcastle Middle School, and Newcastle High School.
Ownership History
Date
Name
Owned For
Owner Type
Purchase Details
Closed on
Feb 25, 2022
Sold by
Nreo Sfr Llc
Bought by
Nexpoint Sfr Spe 1 Llc
Current Estimated Value
Purchase Details
Closed on
Jan 13, 2022
Sold by
Kast Llc
Bought by
Nreo Sfr Llc
Purchase Details
Closed on
Sep 15, 2021
Sold by
Farzaneh Amir M and Farzaneh Katayoun
Bought by
Kast Llc
Home Financials for this Owner
Home Financials are based on the most recent Mortgage that was taken out on this home.
Original Mortgage
$4,633,312
Interest Rate
2.8%
Mortgage Type
Purchase Money Mortgage
Purchase Details
Closed on
Jun 10, 2019
Sold by
Ash Investments Llc
Bought by
Amf Development Llc
Home Financials for this Owner
Home Financials are based on the most recent Mortgage that was taken out on this home.
Original Mortgage
$1,382,800
Interest Rate
4.1%
Mortgage Type
Commercial
Purchase Details
Closed on
Sep 28, 2016
Sold by
Farmington Properties Llc
Bought by
Ash Investments Llc
Create a Home Valuation Report for This Property
The Home Valuation Report is an in-depth analysis detailing your home's value as well as a comparison with similar homes in the area
Home Values in the Area
Average Home Value in this Area
Purchase History
| Date | Buyer | Sale Price | Title Company |
|---|---|---|---|
| Nexpoint Sfr Spe 1 Llc | -- | Chicago Title | |
| Nreo Sfr Llc | $230,000 | Chicago Title | |
| Kast Llc | -- | Chicago Title Oklahoma Co | |
| Amf Development Llc | $312,500 | Chicago Title Oklahoma | |
| Ash Investments Llc | $146,000 | None Available |
Source: Public Records
Mortgage History
| Date | Status | Borrower | Loan Amount |
|---|---|---|---|
| Previous Owner | Kast Llc | $4,633,312 | |
| Previous Owner | Amf Development Llc | $1,382,800 |
Source: Public Records
Tax History Compared to Growth
Tax History
| Year | Tax Paid | Tax Assessment Tax Assessment Total Assessment is a certain percentage of the fair market value that is determined by local assessors to be the total taxable value of land and additions on the property. | Land | Improvement |
|---|---|---|---|---|
| 2025 | $3,727 | $29,938 | $4,290 | $25,648 |
| 2024 | $3,727 | $32,507 | $4,290 | $28,217 |
| 2023 | $3,727 | $35,963 | $4,290 | $31,673 |
| 2022 | $3,962 | $34,320 | $2,267 | $32,053 |
| 2021 | $4,164 | $34,375 | $3,080 | $31,295 |
| 2020 | $4,181 | $34,375 | $3,080 | $31,295 |
| 2019 | $2,524 | $20,445 | $3,300 | $17,145 |
| 2018 | $2,508 | $20,623 | $3,300 | $17,323 |
| 2017 | $2,414 | $19,890 | $3,300 | $16,590 |
| 2016 | $2,308 | $18,942 | $3,300 | $15,642 |
| 2015 | $2,204 | $18,086 | $2,714 | $15,372 |
| 2014 | $311 | $2,585 | $2,585 | $0 |
Source: Public Records
Map
Nearby Homes
- 1667 Wellington Rd
- 1750 Karrington Rd
- 1721 Huntington Ct
- 1213 SE 16th Terrace
- 984 SE 16th Terrace
- 1000 SE 16th Terrace
- 1012 SE 16th Terrace
- 1006 SE 16th Terrace
- 1018 SE 16th Terrace
- 997 SE 16th Terrace
- 1001 SE 16th Terrace
- 1007 SE 16th Terrace
- 1013 SE 16th Terrace
- 929 SE 16th Terrace
- Lockard 22 Plan at Farmington
- Andrew Plan at Farmington
- Tiffany Plan at Farmington
- Taylor Plan at Farmington
- Andrew 22 Plan at Farmington
- Carlisle Plan at Farmington
- 1478 SE 16th Terrace
- 1460 SE 16th Place
- 1681 Lexington Ct
- 1496 SE 16th Place
- 1477 SE 16th Place
- 1514 SE 16th Terrace
- 1678 Lexington Ct
- 1495 SE 16th Terrace
- 1391 SE 16th Place
- 1687 Lexington Ct
- 1513 SE 16th Place
- 1400 SE 16th Place
- 1388 SE 16th Terrace
- 1686 Lexington Ct
- 1686 Karrington Rd
- 1531 SE 16th Place
- 1420 SE 16th St
- 1369 SE 16th Place
- 1697 Lexington Ct
- 1675 Wellington Rd