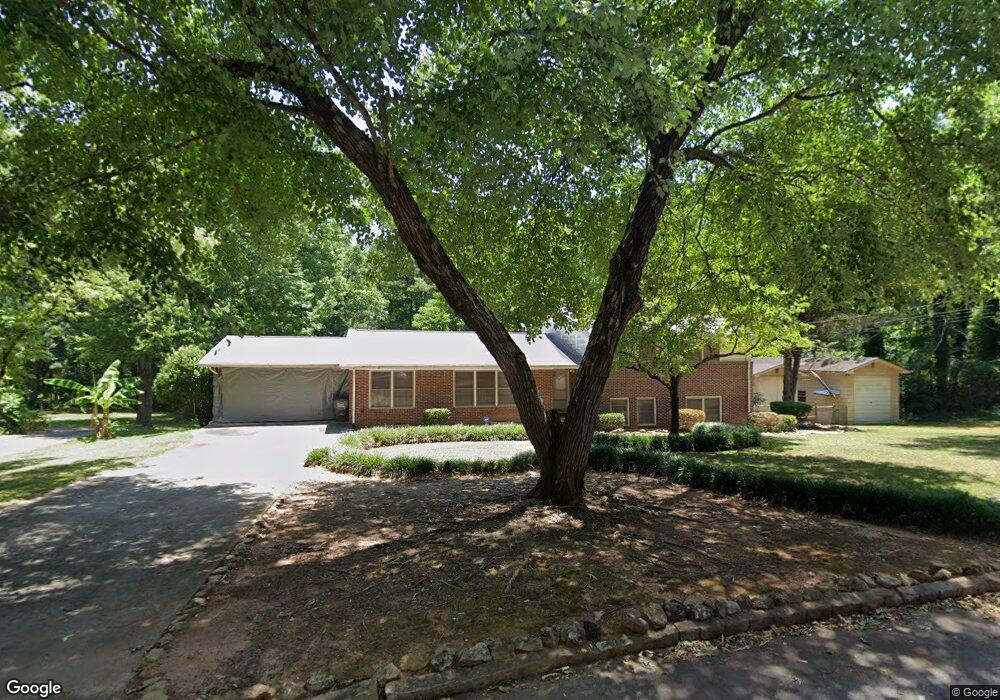
1479 Pineview Ln NW Conyers, GA 30012
Estimated Value: $335,983 - $351,000
4
Beds
3
Baths
2,768
Sq Ft
$124/Sq Ft
Est. Value
About This Home
This home is located at 1479 Pineview Ln NW, Conyers, GA 30012 and is currently estimated at $343,246, approximately $124 per square foot. 1479 Pineview Ln NW is a home located in Rockdale County with nearby schools including Pine Street Elementary School, Conyers Middle School, and Rockdale County High School.
Ownership History
Date
Name
Owned For
Owner Type
Purchase Details
Closed on
Jan 5, 2013
Sold by
Lee Carmen T
Bought by
Lee Robert H
Current Estimated Value
Purchase Details
Closed on
Mar 10, 2009
Sold by
Lee Robert H
Bought by
Lee Robert H and Lee Carmen T
Home Financials for this Owner
Home Financials are based on the most recent Mortgage that was taken out on this home.
Original Mortgage
$130,000
Interest Rate
5.13%
Mortgage Type
Stand Alone Second
Purchase Details
Closed on
Sep 14, 2007
Sold by
Arrugueta Daniel
Bought by
Lee Robert H
Home Financials for this Owner
Home Financials are based on the most recent Mortgage that was taken out on this home.
Original Mortgage
$89,000
Interest Rate
6.57%
Mortgage Type
New Conventional
Purchase Details
Closed on
Apr 16, 1996
Sold by
Riesner Margaret H
Bought by
Arrugueta Daniel
Create a Home Valuation Report for This Property
The Home Valuation Report is an in-depth analysis detailing your home's value as well as a comparison with similar homes in the area
Home Values in the Area
Average Home Value in this Area
Purchase History
| Date | Buyer | Sale Price | Title Company |
|---|---|---|---|
| Lee Robert H | -- | -- | |
| Lee Robert H | -- | -- | |
| Lee Robert H | $189,000 | -- | |
| Lee Robert H | $189,000 | -- | |
| Arrugueta Daniel | $95,000 | -- |
Source: Public Records
Mortgage History
| Date | Status | Borrower | Loan Amount |
|---|---|---|---|
| Previous Owner | Lee Robert H | $130,000 | |
| Previous Owner | Lee Robert H | $89,000 | |
| Closed | Arrugueta Daniel | $0 |
Source: Public Records
Tax History Compared to Growth
Tax History
| Year | Tax Paid | Tax Assessment Tax Assessment Total Assessment is a certain percentage of the fair market value that is determined by local assessors to be the total taxable value of land and additions on the property. | Land | Improvement |
|---|---|---|---|---|
| 2024 | $2,606 | $134,440 | $29,760 | $104,680 |
| 2023 | $1,976 | $115,480 | $21,960 | $93,520 |
| 2022 | $1,890 | $99,880 | $23,520 | $76,360 |
| 2021 | $2,018 | $99,880 | $23,520 | $76,360 |
| 2020 | $1,562 | $82,880 | $11,760 | $71,120 |
| 2019 | $1,327 | $73,640 | $10,120 | $63,520 |
| 2018 | $1,257 | $71,120 | $10,120 | $61,000 |
| 2017 | $1,050 | $64,040 | $10,120 | $53,920 |
| 2016 | $931 | $64,040 | $10,120 | $53,920 |
| 2015 | $873 | $62,040 | $10,120 | $51,920 |
| 2014 | $685 | $60,560 | $8,640 | $51,920 |
| 2013 | -- | $56,920 | $12,480 | $44,440 |
Source: Public Records
Map
Nearby Homes
- 1458 Northside Dr NW
- 0 N Hicks Cir NW Unit 10558065
- 584 Oak Ct NW
- 1436 N Hicks Cir NW
- 00 Hicks Cir N
- 1312 Milstead Ave NE
- 1558 Tanglewood Way NW
- 1268 Woodland Rd NE
- 1254 Woodland Rd NE
- 1349 Springwood Dr NW
- 1547 Mountain View Cir NW
- 1190 Brookside Dr NE
- 1210 Brookside Dr NE
- 134 Odyssey Turn
- 105 Odyssey Turn
- 257 Odyssey Turn
- 1272 Lakeview Dr NW
- 1491 Pineview Ln NW
- 1468 Pineview Ln NW
- 1480 Pineview Ln NW
- 760 Shipp Cir NW
- 1499 Pineview Ln NW
- 750 Shipp Cir NW
- 1490 Pineview Ln NW
- 1509 Pineview Ln NW
- 1471 Northside Dr NW
- 1470 Honeysuckle Dr NW
- 770 Shipp Cir NW
- 1480 Honeysuckle Dr NW
- 1524 Pineview Ln NW
- 1460 Honeysuckle Dr NW
- 1451 Gardner Rd NW
- 1438 Gardner Rd NW
- 1477 Northside Dr NW
- 1455 Gardner Rd NW
- 1447 Gardner Rd NW Unit 35
- 1537 Pineview Ln NW