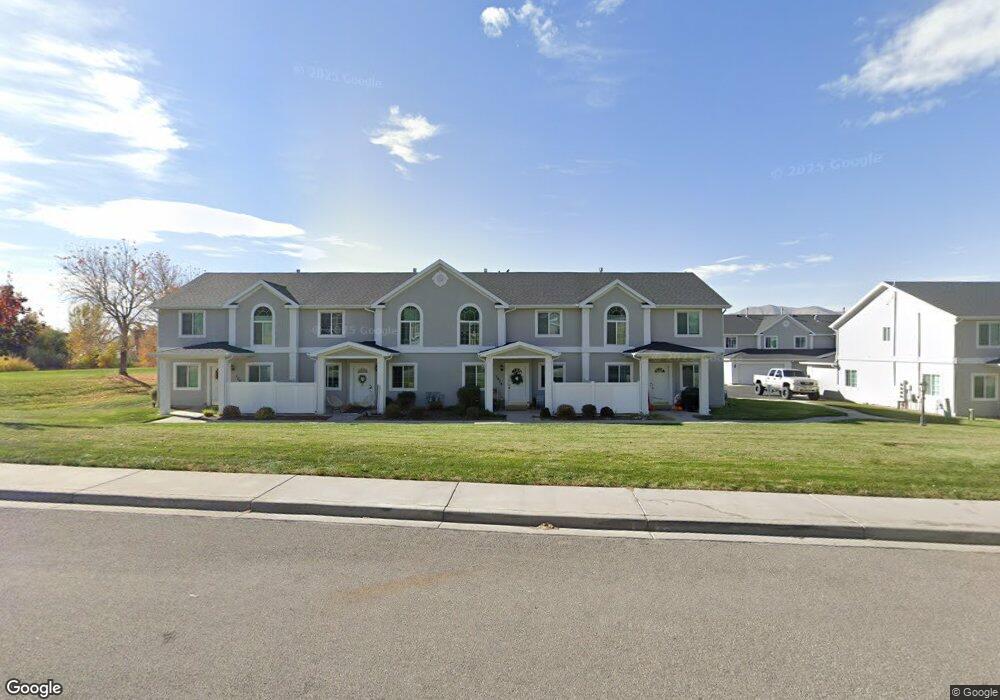
1479 S Red Maple Ct Payson, UT 84651
Estimated Value: $333,000 - $346,000
3
Beds
3
Baths
1,341
Sq Ft
$253/Sq Ft
Est. Value
About This Home
This home is located at 1479 S Red Maple Ct, Payson, UT 84651 and is currently estimated at $339,704, approximately $253 per square foot. 1479 S Red Maple Ct is a home located in Utah County with nearby schools including Spring Lake Elementary, Payson Junior High School, and Payson High School.
Ownership History
Date
Name
Owned For
Owner Type
Purchase Details
Closed on
Oct 2, 2007
Sold by
Blake Donald L and Blake Anita C
Bought by
Zapata Gerardo
Current Estimated Value
Home Financials for this Owner
Home Financials are based on the most recent Mortgage that was taken out on this home.
Original Mortgage
$152,605
Outstanding Balance
$96,215
Interest Rate
6.4%
Mortgage Type
FHA
Estimated Equity
$243,489
Purchase Details
Closed on
Jan 26, 2006
Sold by
Blake Anita C and Blake Donald L
Bought by
Blake Donald L and Blake Anita C
Home Financials for this Owner
Home Financials are based on the most recent Mortgage that was taken out on this home.
Original Mortgage
$112,200
Interest Rate
6.2%
Mortgage Type
Fannie Mae Freddie Mac
Purchase Details
Closed on
Apr 30, 2005
Sold by
Blake Anita C and Blake Donald L
Bought by
Blake Anita C and Blake Donald L
Purchase Details
Closed on
Feb 19, 2004
Sold by
Kriser Homes & Communities Inc
Bought by
Blake Donald L and Blake Anita Cheryl
Home Financials for this Owner
Home Financials are based on the most recent Mortgage that was taken out on this home.
Original Mortgage
$111,451
Interest Rate
5.85%
Mortgage Type
FHA
Create a Home Valuation Report for This Property
The Home Valuation Report is an in-depth analysis detailing your home's value as well as a comparison with similar homes in the area
Home Values in the Area
Average Home Value in this Area
Purchase History
| Date | Buyer | Sale Price | Title Company |
|---|---|---|---|
| Zapata Gerardo | -- | First American Spanish Fo | |
| Blake Donald L | -- | First American Title Agency | |
| Blake Donald L | -- | First American Title Agency | |
| Blake Anita C | -- | -- | |
| Blake Donald L | -- | Mountain West Title Co |
Source: Public Records
Mortgage History
| Date | Status | Borrower | Loan Amount |
|---|---|---|---|
| Open | Zapata Gerardo | $152,605 | |
| Previous Owner | Blake Donald L | $112,200 | |
| Previous Owner | Blake Donald L | $111,451 |
Source: Public Records
Tax History
| Year | Tax Paid | Tax Assessment Tax Assessment Total Assessment is a certain percentage of the fair market value that is determined by local assessors to be the total taxable value of land and additions on the property. | Land | Improvement |
|---|---|---|---|---|
| 2025 | $1,722 | $175,340 | -- | -- |
| 2024 | $1,722 | $175,230 | $0 | $0 |
| 2023 | $1,649 | $168,245 | $0 | $0 |
| 2022 | $1,546 | $155,210 | $0 | $0 |
| 2021 | $1,401 | $225,600 | $33,800 | $191,800 |
| 2020 | $1,326 | $208,800 | $31,300 | $177,500 |
| 2019 | $1,189 | $192,000 | $25,000 | $167,000 |
| 2018 | $1,157 | $180,000 | $22,000 | $158,000 |
| 2017 | $999 | $83,600 | $0 | $0 |
| 2016 | $939 | $78,100 | $0 | $0 |
| 2015 | $899 | $74,250 | $0 | $0 |
| 2014 | $815 | $67,815 | $0 | $0 |
Source: Public Records
Map
Nearby Homes
- 802 Brookside Ct
- 588 W 1450 S
- 1468 S 910 W
- 1631 S Highway 198
- 609 W Saddlebrook Dr
- 613 W Saddlebrook Dr
- 1320 S 950 W
- 347 W 1380 S
- 1338 S 1050 W
- 1172 S 880 W
- 1605 S 1100 W
- 528 W 1150 S
- 1463 S 260 W
- 1116 W 1290 S
- 32 E 1690 S Unit 113
- 1763 S 1100 W Unit 14
- 1848 S 410 W
- 1835 S 410 W
- 245 W 1770 S
- 1146 W 1260 S
- 1483 S Red Maple Ct
- 1475 S Red Maple Ct
- 1487 S Red Maple Ct
- 1478 S Red Maple Ct
- 1473 S Red Maple Ct
- 1474 S Red Maple Ct
- 1482 S Red Maple Ct
- 1486 S Red Maple Ct
- 1469 S Red Maple Ct
- 1472 S Red Maple Ct
- 1465 S Red Maple Ct
- 1468 S Red Maple Ct
- 1466 S Red Maple Ct
- 1481 S Silver Maple Ct
- 1477 S Silver Maple Ct
- 1485 S Silver Maple Ct
- 1483 S 700 W
- 1487 S 700 W
- 1477 S 700 W
- 1471 S Silver Maple Ct
Your Personal Tour Guide
Ask me questions while you tour the home.