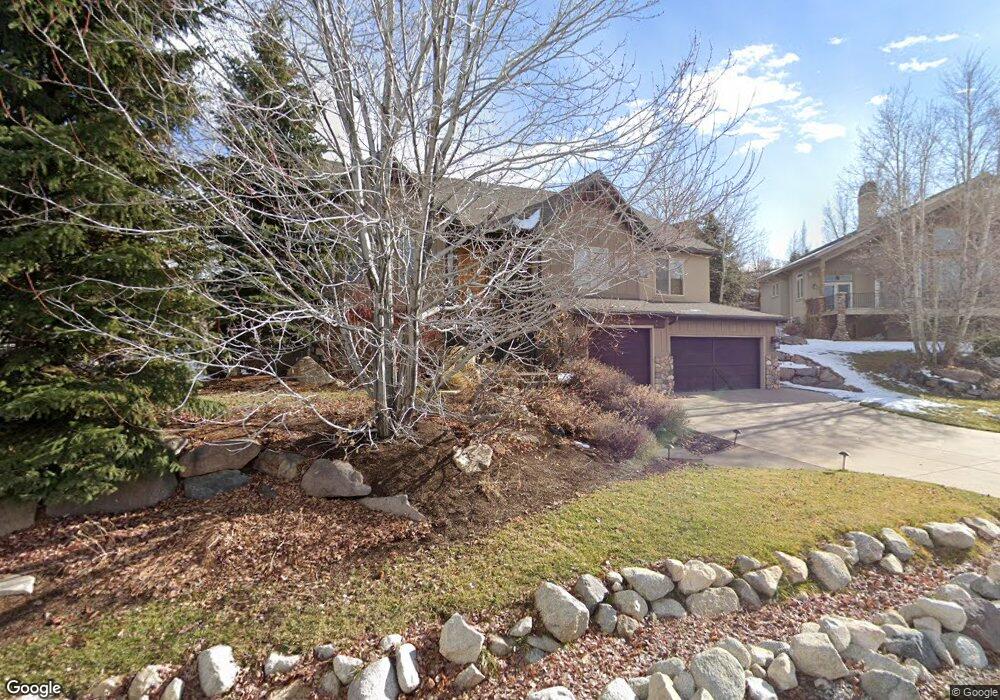
14795 Shadow Grove Ct Draper, UT 84020
Estimated Value: $927,000 - $1,062,000
3
Beds
3
Baths
2,385
Sq Ft
$409/Sq Ft
Est. Value
About This Home
This home is located at 14795 Shadow Grove Ct, Draper, UT 84020 and is currently estimated at $974,914, approximately $408 per square foot. 14795 Shadow Grove Ct is a home located in Salt Lake County with nearby schools including Oak Hollow School, Draper Park Middle School, and Corner Canyon High School.
Ownership History
Date
Name
Owned For
Owner Type
Purchase Details
Closed on
Jun 29, 2023
Sold by
Powick Ellen I and Powick Kolin A
Bought by
Pounders Darrell Wayne
Current Estimated Value
Home Financials for this Owner
Home Financials are based on the most recent Mortgage that was taken out on this home.
Original Mortgage
$710,000
Outstanding Balance
$688,732
Interest Rate
6.39%
Mortgage Type
Construction
Estimated Equity
$286,182
Purchase Details
Closed on
Sep 1, 2009
Sold by
Powick Ellen I and Powick Kolin A
Bought by
Powick Ellen I and Powick Kolin A
Home Financials for this Owner
Home Financials are based on the most recent Mortgage that was taken out on this home.
Original Mortgage
$330,900
Interest Rate
5.19%
Mortgage Type
New Conventional
Purchase Details
Closed on
Aug 17, 2005
Sold by
Red Mountain Builders Llc
Bought by
Powick Kolin A and Powick Ellen I
Home Financials for this Owner
Home Financials are based on the most recent Mortgage that was taken out on this home.
Original Mortgage
$66,896
Interest Rate
5.12%
Mortgage Type
Stand Alone Second
Purchase Details
Closed on
Oct 11, 2004
Sold by
Suncrest Llc
Bought by
Rj Folk Llc
Create a Home Valuation Report for This Property
The Home Valuation Report is an in-depth analysis detailing your home's value as well as a comparison with similar homes in the area
Home Values in the Area
Average Home Value in this Area
Purchase History
| Date | Buyer | Sale Price | Title Company |
|---|---|---|---|
| Pounders Darrell Wayne | -- | Capstone Title & Escrow | |
| Powick Ellen I | -- | Monument Title Ins Co | |
| Powick Kolin A | -- | Sutherland Title | |
| Red Mountain Builders Llc | -- | Sutherland Title | |
| Rj Folk Llc | -- | First American Title |
Source: Public Records
Mortgage History
| Date | Status | Borrower | Loan Amount |
|---|---|---|---|
| Open | Pounders Darrell Wayne | $710,000 | |
| Previous Owner | Powick Ellen I | $330,900 | |
| Previous Owner | Red Mountain Builders Llc | $66,896 | |
| Previous Owner | Powick Kolin A | $356,778 |
Source: Public Records
Tax History
| Year | Tax Paid | Tax Assessment Tax Assessment Total Assessment is a certain percentage of the fair market value that is determined by local assessors to be the total taxable value of land and additions on the property. | Land | Improvement |
|---|---|---|---|---|
| 2025 | $4,645 | $877,200 | $269,300 | $607,900 |
| 2024 | $4,645 | $826,000 | $253,600 | $572,400 |
| 2023 | $4,050 | $715,100 | $228,900 | $486,200 |
| 2022 | $4,203 | $718,500 | $224,400 | $494,100 |
| 2021 | $4,769 | $589,800 | $168,300 | $421,500 |
| 2020 | $3,590 | $511,500 | $130,500 | $381,000 |
| 2019 | $3,593 | $500,400 | $122,000 | $378,400 |
| 2016 | $3,331 | $438,600 | $103,000 | $335,600 |
Source: Public Records
Map
Nearby Homes
- 1945 E Seven Oaks Ln
- 14849 S Saddle Leaf Ct
- 14747 S Haddington Rd
- 14902 S Saddle Leaf Ct
- 14767 S Invergarry Ct
- 1917 E Aspen Leaf Place
- 15095 Alder Glen Ln
- 14634 S Snow Blossom Way Unit 822
- 14798 S Glacial Peak Dr
- 15211 S Tall Woods Dr Unit 24
- 14673 S Ravine Rock Way E Unit 720
- 14833 S Springtime Rd
- 1871 E Vista Ridge Ct
- 14749 S Springtime Rd Unit 620
- 14648 S Springtime Rd
- 14948 S Springtime Rd
- 2433 E Springtime Rd
- 1536 E Trail Crest Ct
- 1492 E Meadow Bluff Ln Unit 48
- 15219 Eagle Crest Dr Unit 141
- 14795 S Shadow Grove Ct
- 11660 S Shadow Grove Ct
- 2000 Seven Oaks Ln
- 2000 E Seven Oaks Ln
- 14815 Shadow Grove Ct
- 14815 S Shadow Grove Ct
- 14804 S Seven Oaks Ln
- 14804 S Seven Oaks Ln Unit 56
- 14804 Seven Oaks Ln
- 14804 Seven Oaks Ln Unit 56
- 14788 Shadow Grove Ct
- 14788 S Shadow Grove Ct
- 1999 E Seven Oaks Ln
- 1999 Seven Oaks Ln
- 1981 E Seven Oaks Ln
- 1981 Seven Oaks Ln
- 1981 Seven Oaks Ln Unit 6
- 14820 Shadow Grove Ct
- 14802 S Shadow Grove Ct
- 14802 Shadow Grove Ct
Your Personal Tour Guide
Ask me questions while you tour the home.