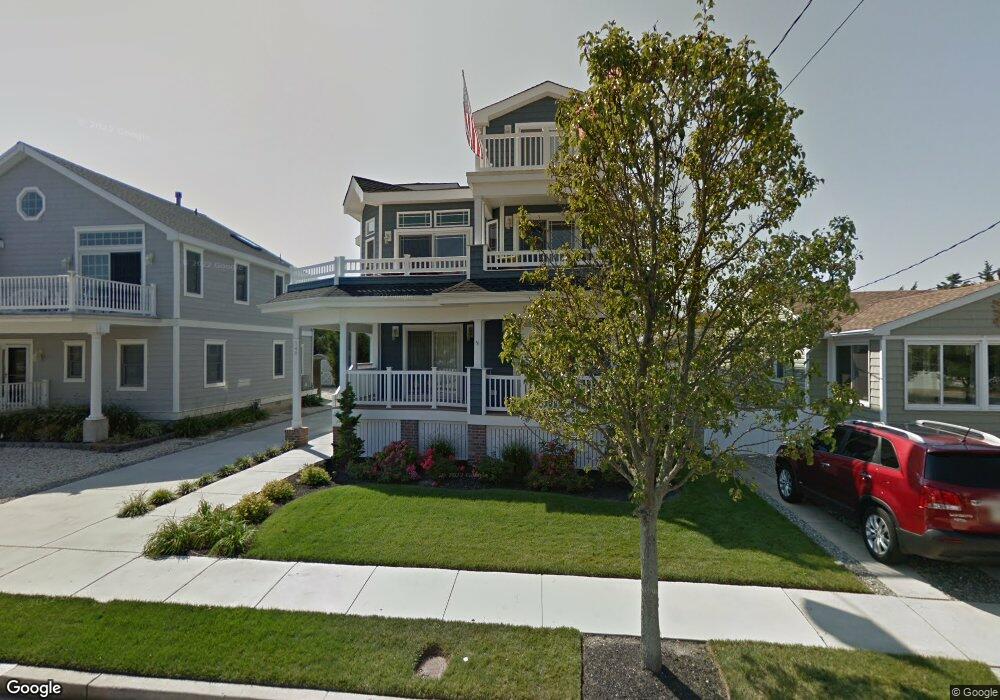
148 16th St Avalon, NJ 08202
Estimated Value: $3,951,329 - $4,995,000
Studio
--
Bath
3,604
Sq Ft
$1,217/Sq Ft
Est. Value
About This Home
This home is located at 148 16th St, Avalon, NJ 08202 and is currently estimated at $4,386,582, approximately $1,217 per square foot. 148 16th St is a home with nearby schools including Avalon Elementary School.
Ownership History
Date
Name
Owned For
Owner Type
Purchase Details
Closed on
Aug 26, 2013
Sold by
Pron Michael J and Pron Nancy J
Bought by
Pron Michael J
Current Estimated Value
Purchase Details
Closed on
Oct 12, 2011
Sold by
Fishbein Joel P
Bought by
Pron Michael J and Pron Nancy J
Home Financials for this Owner
Home Financials are based on the most recent Mortgage that was taken out on this home.
Original Mortgage
$1,067,500
Outstanding Balance
$728,427
Interest Rate
4.11%
Mortgage Type
New Conventional
Estimated Equity
$3,658,155
Purchase Details
Closed on
Jun 7, 2010
Sold by
Hunter Janet
Bought by
Fishbein Joel P
Home Financials for this Owner
Home Financials are based on the most recent Mortgage that was taken out on this home.
Original Mortgage
$417,000
Interest Rate
4.98%
Mortgage Type
New Conventional
Create a Home Valuation Report for This Property
The Home Valuation Report is an in-depth analysis detailing your home's value as well as a comparison with similar homes in the area
Home Values in the Area
Average Home Value in this Area
Purchase History
We collect this data history from publicly available records. To have your information removed, we recommend requesting removal directly through your county’s website.
| Date | Buyer | Sale Price | Title Company |
|---|---|---|---|
| Pron Michael J | -- | None Available | |
| Pron Michael J | $1,525,000 | Multiple | |
| Fishbein Joel P | $575,000 | Surety Title Corporation |
Source: Public Records
Mortgage History
We collect this data history from publicly available records. To have your information removed, we recommend requesting removal directly through your county’s website.
| Date | Status | Borrower | Loan Amount |
|---|---|---|---|
| Open | Pron Michael J | $1,067,500 | |
| Previous Owner | Fishbein Joel P | $417,000 |
Source: Public Records
Tax History
| Year | Tax Paid | Tax Assessment Tax Assessment Total Assessment is a certain percentage of the fair market value that is determined by local assessors to be the total taxable value of land and additions on the property. | Land | Improvement |
|---|---|---|---|---|
| 2025 | $11,859 | $1,931,400 | $900,000 | $1,031,400 |
| 2024 | $11,859 | $1,931,400 | $900,000 | $1,031,400 |
| 2023 | $11,762 | $1,931,400 | $900,000 | $1,031,400 |
| 2022 | $10,970 | $1,931,400 | $900,000 | $1,031,400 |
| 2021 | $10,565 | $1,931,400 | $900,000 | $1,031,400 |
| 2020 | $10,159 | $1,931,400 | $900,000 | $1,031,400 |
| 2019 | $9,850 | $1,931,400 | $900,000 | $1,031,400 |
| 2018 | $9,425 | $1,931,400 | $900,000 | $1,031,400 |
| 2017 | $9,130 | $1,642,000 | $700,000 | $942,000 |
| 2016 | $9,031 | $1,642,000 | $700,000 | $942,000 |
| 2015 | $8,883 | $1,642,000 | $700,000 | $942,000 |
| 2014 | $8,785 | $1,642,000 | $700,000 | $942,000 |
Source: Public Records
Map
Nearby Homes
Your Personal Tour Guide
Ask me questions while you tour the home.