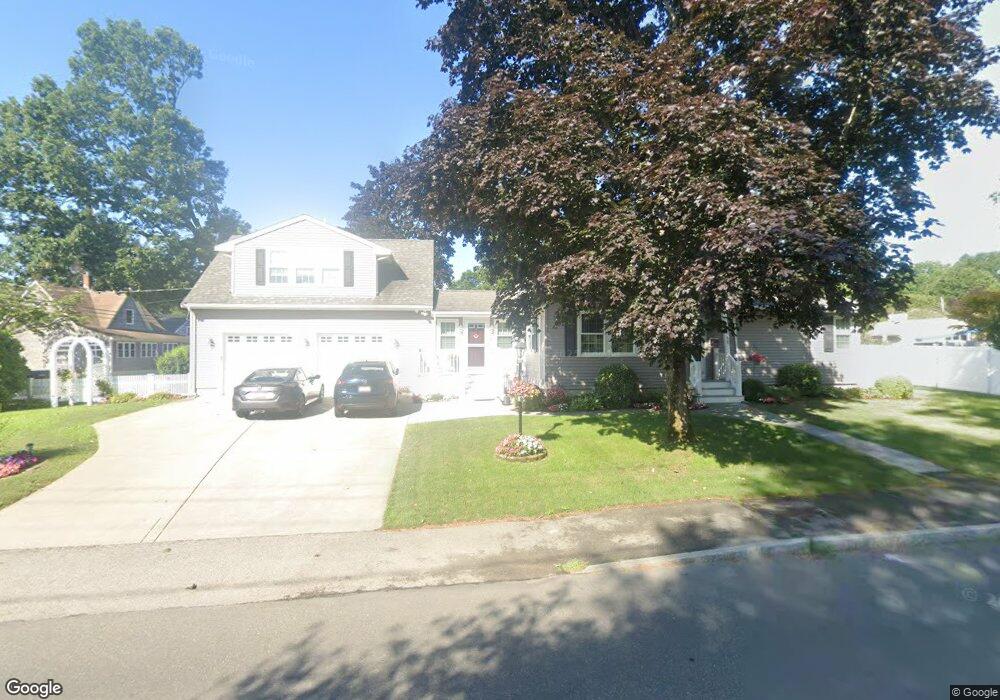
148 Adams St Fairhaven, MA 02719
Oxford NeighborhoodEstimated Value: $515,000 - $592,000
2
Beds
2
Baths
1,899
Sq Ft
$288/Sq Ft
Est. Value
About This Home
This home is located at 148 Adams St, Fairhaven, MA 02719 and is currently estimated at $547,776, approximately $288 per square foot. 148 Adams St is a home located in Bristol County with nearby schools including Fairhaven High School, Alma Del Mar Charter School, and City On A Hill Charter Public School New Bedford.
Ownership History
Date
Name
Owned For
Owner Type
Purchase Details
Closed on
Dec 13, 2024
Sold by
Andrade Richard A and Andrade Debra A
Bought by
Andre Lt and Andre
Current Estimated Value
Purchase Details
Closed on
Oct 29, 1999
Sold by
Boutin Bernard F and Boutin Catherine M
Bought by
Andre Richard A and Andre Debra A
Home Financials for this Owner
Home Financials are based on the most recent Mortgage that was taken out on this home.
Original Mortgage
$110,000
Interest Rate
7.78%
Mortgage Type
Purchase Money Mortgage
Create a Home Valuation Report for This Property
The Home Valuation Report is an in-depth analysis detailing your home's value as well as a comparison with similar homes in the area
Home Values in the Area
Average Home Value in this Area
Purchase History
| Date | Buyer | Sale Price | Title Company |
|---|---|---|---|
| Andre Lt | -- | None Available | |
| Andre Lt | -- | None Available | |
| Andre Richard A | $150,000 | -- | |
| Andre Richard A | $150,000 | -- |
Source: Public Records
Mortgage History
| Date | Status | Borrower | Loan Amount |
|---|---|---|---|
| Previous Owner | Andre Richard A | $108,000 | |
| Previous Owner | Andre Richard A | $110,000 |
Source: Public Records
Tax History Compared to Growth
Tax History
| Year | Tax Paid | Tax Assessment Tax Assessment Total Assessment is a certain percentage of the fair market value that is determined by local assessors to be the total taxable value of land and additions on the property. | Land | Improvement |
|---|---|---|---|---|
| 2025 | $44 | $472,000 | $179,100 | $292,900 |
| 2024 | $4,048 | $438,600 | $179,100 | $259,500 |
| 2023 | $3,882 | $390,200 | $156,900 | $233,300 |
| 2022 | $3,671 | $359,200 | $145,800 | $213,400 |
| 2021 | $3,502 | $310,200 | $131,900 | $178,300 |
| 2020 | $3,431 | $310,200 | $131,900 | $178,300 |
| 2019 | $3,313 | $283,900 | $109,400 | $174,500 |
| 2018 | $3,305 | $271,500 | $104,200 | $167,300 |
| 2017 | $3,194 | $265,300 | $104,200 | $161,100 |
| 2016 | $3,208 | $263,400 | $104,200 | $159,200 |
| 2015 | $2,911 | $239,600 | $104,200 | $135,400 |
Source: Public Records
Map
Nearby Homes