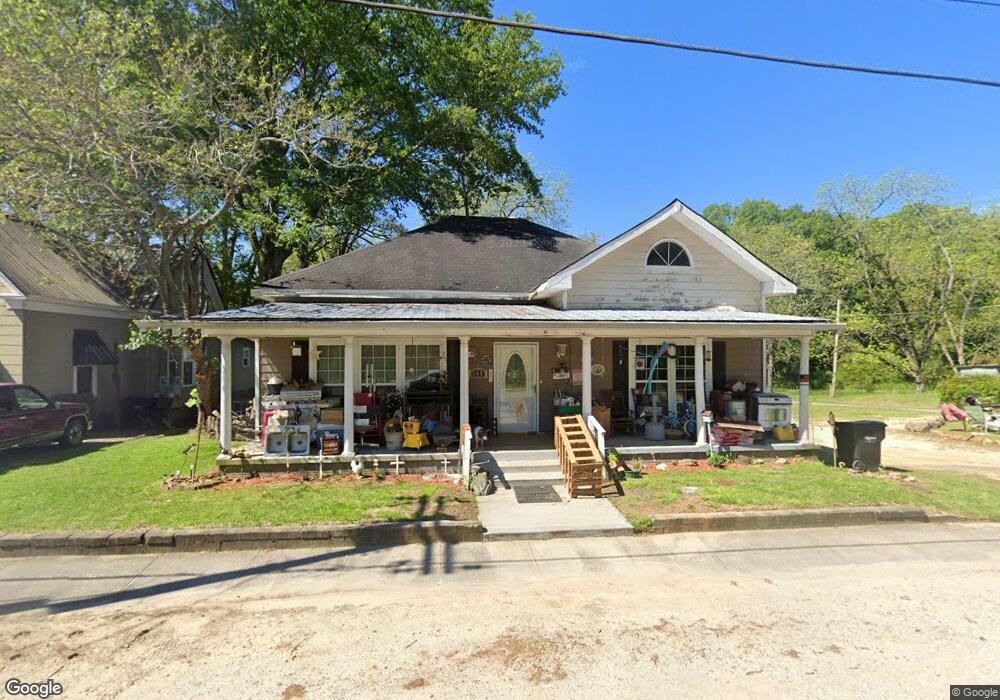
148 Atlanta St Barnesville, GA 30204
Estimated Value: $91,000 - $203,000
2
Beds
2
Baths
2,144
Sq Ft
$72/Sq Ft
Est. Value
About This Home
This home is located at 148 Atlanta St, Barnesville, GA 30204 and is currently estimated at $153,405, approximately $71 per square foot. 148 Atlanta St is a home located in Lamar County with nearby schools including Lamar County Primary School, Lamar County Elementary School, and Lamar County Middle School.
Ownership History
Date
Name
Owned For
Owner Type
Purchase Details
Closed on
Nov 16, 2017
Sold by
Evans Jessica
Bought by
Mickler Helen Anastasia and Mickler Nathaniel Bryant
Current Estimated Value
Purchase Details
Closed on
Dec 9, 2015
Sold by
Lonberg Jacob Alan
Bought by
Evans Jessica and Evans Britney
Purchase Details
Closed on
Dec 2, 2014
Sold by
Andrea L Anthony Lamar County Tax Commis
Bought by
Lonberg Jacob Alan
Purchase Details
Closed on
Dec 1, 1985
Sold by
Priobau Juanita
Bought by
Evans Bob and Evans Nancy
Create a Home Valuation Report for This Property
The Home Valuation Report is an in-depth analysis detailing your home's value as well as a comparison with similar homes in the area
Home Values in the Area
Average Home Value in this Area
Purchase History
| Date | Buyer | Sale Price | Title Company |
|---|---|---|---|
| Mickler Helen Anastasia | $25,000 | -- | |
| Evans Jessica | $5,926 | -- | |
| Lonberg Jacob Alan | $3,900 | -- | |
| Evans Bob | $18,000 | -- |
Source: Public Records
Tax History Compared to Growth
Tax History
| Year | Tax Paid | Tax Assessment Tax Assessment Total Assessment is a certain percentage of the fair market value that is determined by local assessors to be the total taxable value of land and additions on the property. | Land | Improvement |
|---|---|---|---|---|
| 2025 | $925 | $36,820 | $2,800 | $34,020 |
| 2024 | $925 | $32,284 | $2,800 | $29,484 |
| 2023 | $997 | $32,284 | $2,800 | $29,484 |
| 2022 | $1,028 | $37,245 | $2,800 | $34,445 |
| 2021 | $872 | $29,008 | $2,800 | $26,208 |
| 2020 | $1,061 | $33,508 | $2,800 | $30,708 |
| 2019 | $1,165 | $36,700 | $2,800 | $33,900 |
| 2018 | $1,093 | $35,884 | $2,800 | $33,084 |
| 2017 | $1,088 | $35,884 | $2,800 | $33,084 |
| 2016 | $1,088 | $35,884 | $2,800 | $33,084 |
| 2015 | $1,086 | $35,884 | $2,800 | $33,084 |
| 2014 | $1,031 | $37,125 | $2,800 | $34,325 |
| 2013 | -- | $36,555 | $2,230 | $34,325 |
Source: Public Records
Map
Nearby Homes