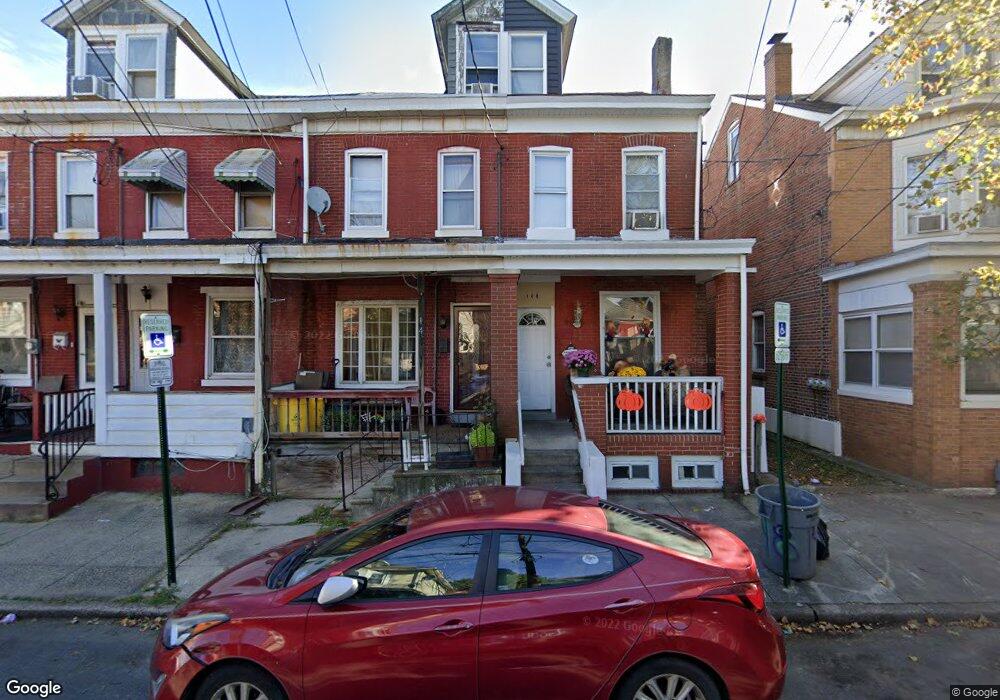
148 Barnt Ave Trenton, NJ 08611
South Trenton NeighborhoodEstimated Value: $210,507 - $269,000
4
Beds
2
Baths
1,352
Sq Ft
$178/Sq Ft
Est. Value
About This Home
This home is located at 148 Barnt Ave, Trenton, NJ 08611 and is currently estimated at $240,127, approximately $177 per square foot. 148 Barnt Ave is a home located in Mercer County with nearby schools including Franklin Elementary School, Parker Elementary School, and Dr. Crosby Copeland Elementary School.
Ownership History
Date
Name
Owned For
Owner Type
Purchase Details
Closed on
Apr 25, 2013
Sold by
Watson Christopher
Bought by
Nostaw Propeties Llc
Current Estimated Value
Purchase Details
Closed on
Apr 5, 2013
Sold by
Watson Christopher and Jones William
Bought by
Watson Christopher
Purchase Details
Closed on
Nov 24, 2009
Sold by
Ezri Properties Llc
Bought by
Watson Christopher and Jones William
Purchase Details
Closed on
Nov 16, 2009
Sold by
Krawczun Victor Michael
Bought by
Ezri Properties Llc
Create a Home Valuation Report for This Property
The Home Valuation Report is an in-depth analysis detailing your home's value as well as a comparison with similar homes in the area
Home Values in the Area
Average Home Value in this Area
Purchase History
| Date | Buyer | Sale Price | Title Company |
|---|---|---|---|
| Nostaw Propeties Llc | -- | None Available | |
| Nostaw Properties Llc | -- | None Available | |
| Watson Christopher | -- | None Available | |
| Watson Christopher | -- | None Available | |
| Watson Christopher | $43,500 | Successful Title | |
| Ezri Properties Llc | $22,000 | Successful Title |
Source: Public Records
Tax History Compared to Growth
Tax History
| Year | Tax Paid | Tax Assessment Tax Assessment Total Assessment is a certain percentage of the fair market value that is determined by local assessors to be the total taxable value of land and additions on the property. | Land | Improvement |
|---|---|---|---|---|
| 2025 | $3,254 | $56,100 | $9,500 | $46,600 |
| 2024 | $3,123 | $56,100 | $9,500 | $46,600 |
| 2023 | $3,123 | $56,100 | $9,500 | $46,600 |
| 2022 | $3,062 | $56,100 | $9,500 | $46,600 |
| 2021 | $3,115 | $56,100 | $9,500 | $46,600 |
| 2020 | $3,105 | $56,100 | $9,500 | $46,600 |
| 2019 | $3,055 | $56,100 | $9,500 | $46,600 |
| 2018 | $2,924 | $56,100 | $9,500 | $46,600 |
| 2017 | $2,780 | $56,100 | $9,500 | $46,600 |
| 2016 | $3,521 | $61,200 | $16,000 | $45,200 |
| 2015 | $3,509 | $61,200 | $16,000 | $45,200 |
| 2014 | $3,492 | $61,200 | $16,000 | $45,200 |
Source: Public Records
Map
Nearby Homes