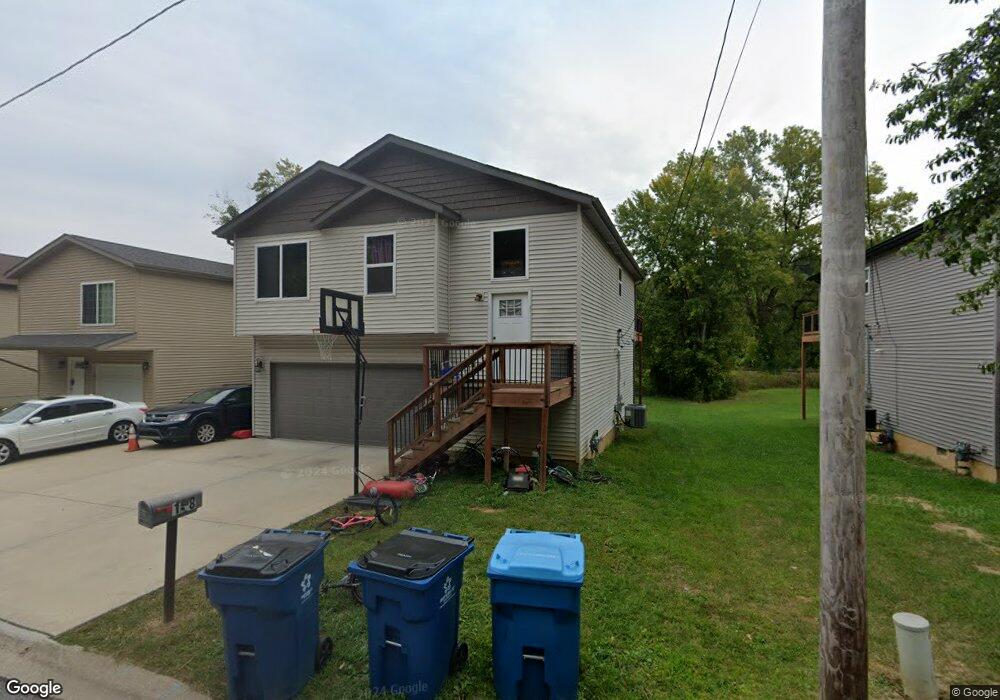
148 Black Jack Rd Collinsville, IL 62234
Estimated Value: $134,000 - $173,955
2
Beds
2
Baths
1,081
Sq Ft
$143/Sq Ft
Est. Value
About This Home
This home is located at 148 Black Jack Rd, Collinsville, IL 62234 and is currently estimated at $154,489, approximately $142 per square foot. 148 Black Jack Rd is a home located in Madison County with nearby schools including Webster Elementary School, Dorris Intermediate School, and Collinsville Middle School.
Ownership History
Date
Name
Owned For
Owner Type
Purchase Details
Closed on
May 28, 2003
Sold by
Bank One Na
Bought by
Turner Sean R
Current Estimated Value
Home Financials for this Owner
Home Financials are based on the most recent Mortgage that was taken out on this home.
Original Mortgage
$19,500
Interest Rate
6.5%
Mortgage Type
Purchase Money Mortgage
Purchase Details
Closed on
Apr 15, 2003
Sold by
Fraise Walter
Bought by
Bank One Na
Home Financials for this Owner
Home Financials are based on the most recent Mortgage that was taken out on this home.
Original Mortgage
$19,500
Interest Rate
6.5%
Mortgage Type
Purchase Money Mortgage
Create a Home Valuation Report for This Property
The Home Valuation Report is an in-depth analysis detailing your home's value as well as a comparison with similar homes in the area
Home Values in the Area
Average Home Value in this Area
Purchase History
| Date | Buyer | Sale Price | Title Company |
|---|---|---|---|
| Turner Sean R | $19,500 | Fatic | |
| Bank One Na | -- | -- |
Source: Public Records
Mortgage History
| Date | Status | Borrower | Loan Amount |
|---|---|---|---|
| Closed | Turner Sean R | $19,500 |
Source: Public Records
Tax History Compared to Growth
Tax History
| Year | Tax Paid | Tax Assessment Tax Assessment Total Assessment is a certain percentage of the fair market value that is determined by local assessors to be the total taxable value of land and additions on the property. | Land | Improvement |
|---|---|---|---|---|
| 2024 | $3,478 | $54,410 | $3,190 | $51,220 |
| 2023 | $3,478 | $50,360 | $2,950 | $47,410 |
| 2022 | $3,314 | $45,130 | $2,640 | $42,490 |
| 2021 | $2,929 | $42,400 | $2,480 | $39,920 |
| 2020 | $2,824 | $40,460 | $2,370 | $38,090 |
| 2019 | $2,750 | $39,080 | $2,290 | $36,790 |
| 2018 | $2,855 | $39,320 | $2,170 | $37,150 |
| 2017 | $376 | $5,070 | $2,130 | $2,940 |
| 2016 | $396 | $5,070 | $2,130 | $2,940 |
| 2015 | $369 | $4,930 | $2,070 | $2,860 |
| 2014 | $369 | $4,930 | $2,070 | $2,860 |
| 2013 | $369 | $4,930 | $2,070 | $2,860 |
Source: Public Records
Map
Nearby Homes
- 238 Mill St
- 921 Prospect St
- 919 Vine St
- 404 E Church St
- 216 S Chestnut St
- 501 Spring
- 110 E Church St
- 6506 Timber Lake Dr
- 617 N Morrison Ave
- 121 S Seminary St
- 308 Brown Ave
- 1210 Constance St
- 123 W Wickliffe Ave
- 1120 Williams St
- 6430 Lebanon Rd
- 419 Bell St
- 506 W Clay St
- 0 Strong Ave
- 892 Lester Ave
- 580 N Guernsey St
- 146 Black Jack Rd
- 152 Black Jack Rd
- 113 Black Jack Rd
- 154 Black Jack Rd
- 111 Black Jack Rd
- 143 Black Jack Rd
- 147 Black Jack Rd
- 156 Black Jack Rd
- 139 Black Jack Rd
- 158 Black Jack Rd
- 149 Black Jack Rd
- 121 Black Jack Rd
- 157 Black Jack Rd
- 801 Black Jack Rd
- 126 Black Jack Rd
- 123 Black Jack Rd
- 803 Black Jack Rd
- 805 Black Jack Rd
- 807 Black Jack Rd
- 159 Black Jack Rd