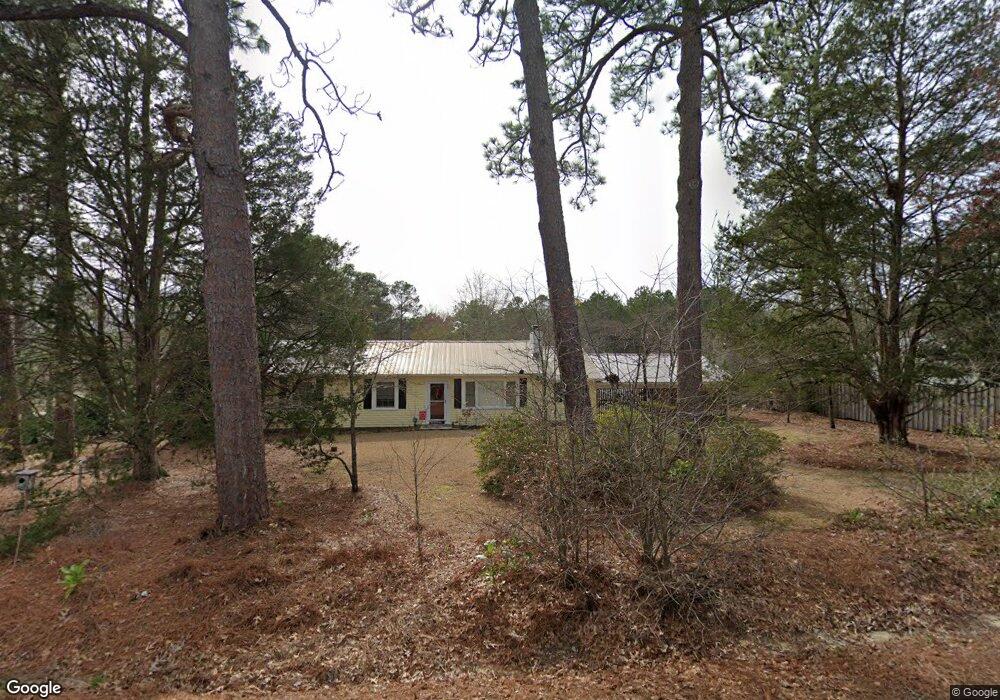
148 Branch Rd Carthage, NC 28327
Estimated Value: $222,512 - $317,000
3
Beds
1
Bath
1,430
Sq Ft
$181/Sq Ft
Est. Value
About This Home
This home is located at 148 Branch Rd, Carthage, NC 28327 and is currently estimated at $258,628, approximately $180 per square foot. 148 Branch Rd is a home located in Moore County with nearby schools including Carthage Elementary School, New Century Middle School, and Union Pines High School.
Ownership History
Date
Name
Owned For
Owner Type
Purchase Details
Closed on
Mar 21, 2025
Sold by
Kiser Buie Kathy
Bought by
Kiser Buie Kathy and Mashburn Robert F
Current Estimated Value
Purchase Details
Closed on
Nov 12, 2024
Sold by
Kiser Buie Kathy
Bought by
Buie Kathy Kiser and Mashburn Anita
Purchase Details
Closed on
May 9, 2024
Sold by
Mashburn Anita
Bought by
Mashburn Robert F and Buie Kathy K
Create a Home Valuation Report for This Property
The Home Valuation Report is an in-depth analysis detailing your home's value as well as a comparison with similar homes in the area
Home Values in the Area
Average Home Value in this Area
Purchase History
| Date | Buyer | Sale Price | Title Company |
|---|---|---|---|
| Kiser Buie Kathy | -- | None Listed On Document | |
| Kiser Buie Kathy | -- | None Listed On Document | |
| Mashburn Robert F | -- | None Listed On Document | |
| Mashburn Robert F | -- | None Listed On Document | |
| Mashburn Robert F | -- | None Listed On Document | |
| Mashburn Robert F | -- | None Listed On Document | |
| Mashburn Robert F | -- | None Listed On Document | |
| Mashburn Robert F | -- | None Listed On Document | |
| Mashburn Robert F | -- | None Listed On Document | |
| Mashburn Robert F | -- | None Listed On Document | |
| Mashburn Robert F | -- | None Listed On Document | |
| Mashburn Robert F | -- | None Listed On Document | |
| Buie Kathy Kiser | -- | None Listed On Document | |
| Mashburn Robert F | -- | None Listed On Document | |
| Mashburn Robert F | -- | None Listed On Document | |
| Mashburn Robert F | -- | None Listed On Document | |
| Mashburn Robert F | -- | None Listed On Document | |
| Mashburn Robert F | -- | None Listed On Document |
Source: Public Records
Tax History Compared to Growth
Tax History
| Year | Tax Paid | Tax Assessment Tax Assessment Total Assessment is a certain percentage of the fair market value that is determined by local assessors to be the total taxable value of land and additions on the property. | Land | Improvement |
|---|---|---|---|---|
| 2024 | $1,195 | $140,140 | $31,890 | $108,250 |
| 2023 | $1,223 | $140,140 | $31,890 | $108,250 |
| 2022 | $911 | $88,460 | $10,640 | $77,820 |
| 2021 | $933 | $88,460 | $10,640 | $77,820 |
| 2020 | $942 | $83,170 | $10,640 | $72,530 |
| 2019 | $942 | $88,460 | $10,640 | $77,820 |
| 2018 | $844 | $79,900 | $8,740 | $71,160 |
| 2017 | $836 | $79,900 | $8,740 | $71,160 |
| 2015 | $783 | $79,900 | $8,740 | $71,160 |
| 2014 | $711 | $77,660 | $9,560 | $68,100 |
| 2013 | -- | $77,660 | $9,560 | $68,100 |
Source: Public Records
Map
Nearby Homes
- 255 Mullingar Dr
- 3402 Alibird Ln
- 1105 Gracie Ln
- 1410 Gracie Ln
- 204 Savannah Garden Dr
- 280 Robert Place
- 400 Apricot Ln
- Hayden Plan at Southbury
- Cali Plan at Southbury
- BELHAVEN Plan at Southbury
- Wilmington Plan at Southbury
- 424 Bingham St
- 926 Ocean Ct
- 101 Enfield Dr
- 129 Enfield Dr
- 109 Enfield Dr
- 273 Dona Dr
- Morgan Plan at Tyson’s Trail Estates
- Taylor Plan at Tyson’s Trail Estates
- Franklin Plan at Tyson’s Trail Estates
- 136 Branch Rd
- 123 Freeman Rd
- 149 Freeman Rd
- 288 Niagara Carthage Rd
- 144 Freeman Rd
- 310 Niagara Carthage Rd
- 157 Freeman Rd
- 312 Niagara Carthage Rd
- 118 Branch Rd
- 328 Niagara Carthage Rd
- 166 Freeman Rd
- 169 Freeman Rd
- 182 Freeman Rd
- 261 Niagara Carthage Rd
- 188 Freeman Rd
- 172 Freeman Rd
- 200 Freeman Rd
- 115 Wave Rd
- 205 Freeman Rd
- 174 Freeman Rd