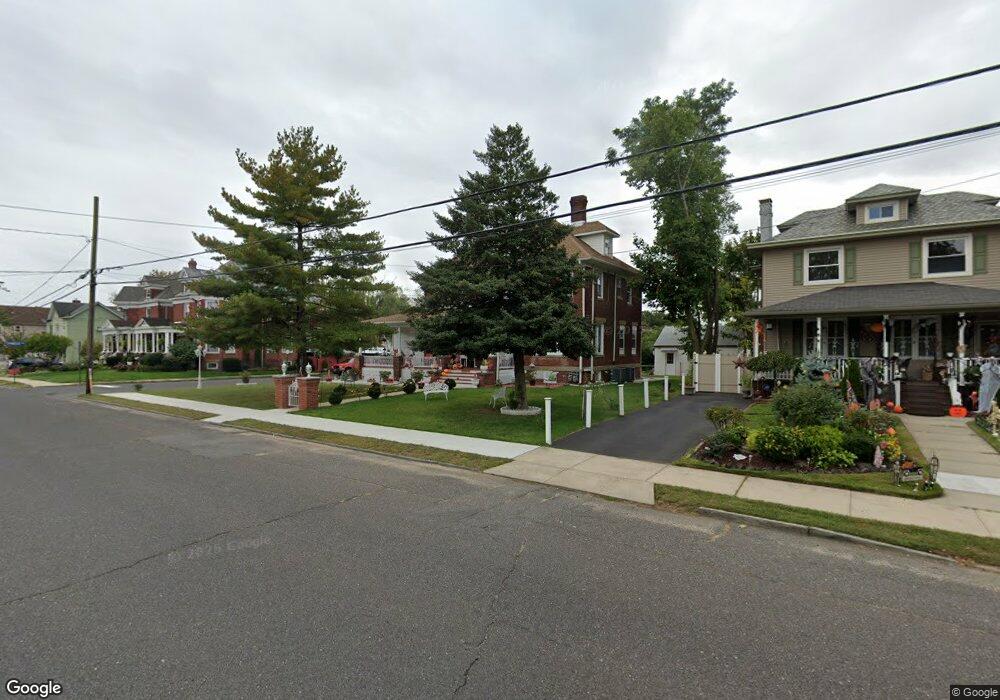
148 Broadway Keyport, NJ 07735
Estimated Value: $705,000 - $869,000
8
Beds
3
Baths
3,021
Sq Ft
$251/Sq Ft
Est. Value
About This Home
This home is located at 148 Broadway, Keyport, NJ 07735 and is currently estimated at $758,415, approximately $251 per square foot. 148 Broadway is a home located in Monmouth County with nearby schools including Keyport Central School, Keyport High School, and Icob Academy.
Ownership History
Date
Name
Owned For
Owner Type
Purchase Details
Closed on
Feb 9, 1998
Sold by
Welch Ruth
Bought by
Flores Jose
Current Estimated Value
Home Financials for this Owner
Home Financials are based on the most recent Mortgage that was taken out on this home.
Original Mortgage
$153,000
Outstanding Balance
$26,917
Interest Rate
6.93%
Mortgage Type
FHA
Estimated Equity
$731,498
Create a Home Valuation Report for This Property
The Home Valuation Report is an in-depth analysis detailing your home's value as well as a comparison with similar homes in the area
Home Values in the Area
Average Home Value in this Area
Purchase History
| Date | Buyer | Sale Price | Title Company |
|---|---|---|---|
| Flores Jose | $160,000 | -- |
Source: Public Records
Mortgage History
| Date | Status | Borrower | Loan Amount |
|---|---|---|---|
| Open | Flores Jose | $153,000 |
Source: Public Records
Tax History
| Year | Tax Paid | Tax Assessment Tax Assessment Total Assessment is a certain percentage of the fair market value that is determined by local assessors to be the total taxable value of land and additions on the property. | Land | Improvement |
|---|---|---|---|---|
| 2025 | $11,799 | $618,300 | $220,000 | $398,300 |
| 2024 | $11,680 | $570,000 | $191,300 | $378,700 |
| 2023 | $11,680 | $531,400 | $173,900 | $357,500 |
| 2022 | $10,878 | $462,000 | $151,200 | $310,800 |
| 2021 | $10,878 | $431,000 | $140,000 | $291,000 |
| 2020 | $10,370 | $407,800 | $131,000 | $276,800 |
| 2019 | $9,966 | $392,500 | $122,000 | $270,500 |
| 2018 | $9,753 | $375,100 | $122,000 | $253,100 |
| 2017 | $9,695 | $371,900 | $122,000 | $249,900 |
| 2016 | $9,802 | $379,200 | $122,000 | $257,200 |
| 2015 | $10,224 | $393,700 | $140,000 | $253,700 |
| 2014 | $8,966 | $348,600 | $122,000 | $226,600 |
Source: Public Records
Map
Nearby Homes
- 95 Broadway
- 2 Chingarora Ave
- 104 Therese Ave
- 253 Broadway
- 52 Highway 35
- 284 Washington St
- 9 Kearney St Unit A
- 301 Ryan St
- 5 Lower Main St
- 22 Lower Main St
- 369 Riverdale Dr
- 75 Broad St
- 226 Osborn St
- 55 Lower Main St
- 104 Church St
- 55 E Front St
- 40 Church St
- 87 Church St
- 9 Hurley St
- 231 Atlantic St Unit 23
- 142 Broadway
- 10 Chandler Ave
- 136 Broadway
- 158 Broadway
- 127 Washington St
- 129 Washington St
- 151 Broadway None
- 162 Broadway
- 132 Broadway
- 125 Washington St
- 149 Broadway Unit 151
- 137 Washington St
- 151 Broadway
- 166 Broadway
- 89 Washington St
- 147 Broadway
- 139 Washington St
- 168 Broadway
- 18 Chandler Ave
- 122 Broadway
Your Personal Tour Guide
Ask me questions while you tour the home.