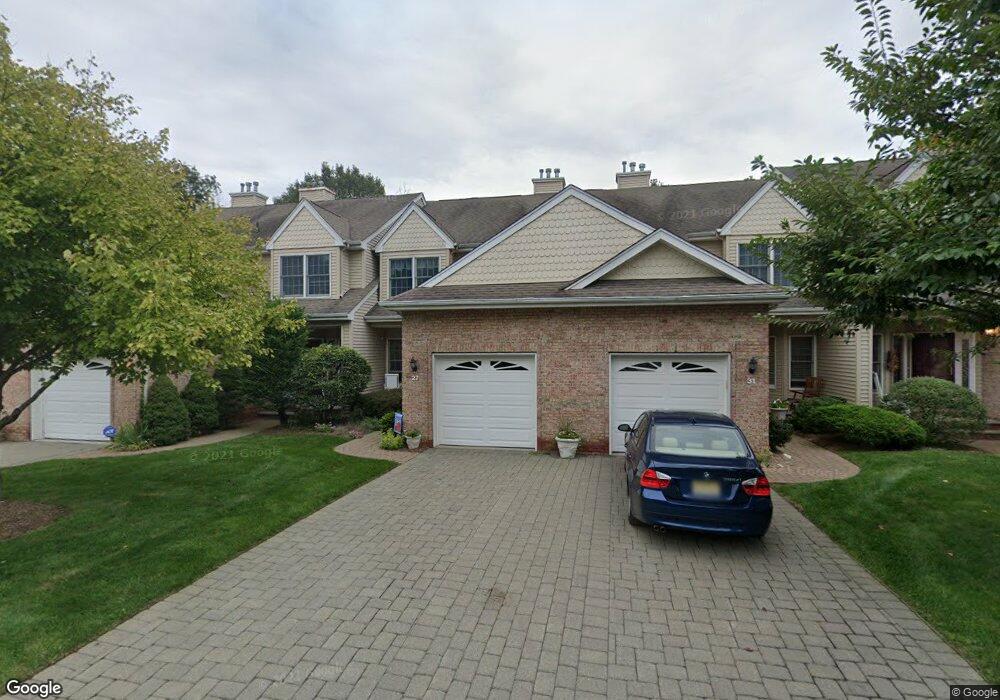
148 Carriage Ct Allendale, NJ 07401
Estimated Value: $690,000 - $724,000
2
Beds
3
Baths
1,618
Sq Ft
$435/Sq Ft
Est. Value
About This Home
This home is located at 148 Carriage Ct, Allendale, NJ 07401 and is currently estimated at $704,583, approximately $435 per square foot. 148 Carriage Ct is a home located in Bergen County with nearby schools including Hillside Elementary School, Brookside Elementary School, and Northern Highlands Reg High School.
Ownership History
Date
Name
Owned For
Owner Type
Purchase Details
Closed on
Aug 15, 2025
Sold by
Bai Charlene
Bought by
Charlene Bai Revocable Trust and Bai
Current Estimated Value
Purchase Details
Closed on
May 15, 2025
Sold by
Bai Charlene and Bai Grace
Bought by
Bai Charlene
Purchase Details
Closed on
Aug 14, 2023
Sold by
Bai Charlene
Bought by
Bai Charlene and Bai Grace
Purchase Details
Closed on
Mar 30, 2016
Sold by
Bai Charlene and Bai Ben
Bought by
Bai Charlene C
Purchase Details
Closed on
Nov 19, 2014
Sold by
Bai Oak N
Bought by
Bai Charlene and Bai Ben
Purchase Details
Closed on
Jul 15, 2004
Sold by
Kwon John
Bought by
Oak Bai
Home Financials for this Owner
Home Financials are based on the most recent Mortgage that was taken out on this home.
Original Mortgage
$454,500
Interest Rate
6.28%
Purchase Details
Closed on
May 30, 2002
Sold by
Allendale Brook Assoc Llc
Bought by
Kwon John and Kwon Susan
Home Financials for this Owner
Home Financials are based on the most recent Mortgage that was taken out on this home.
Original Mortgage
$272,000
Interest Rate
6.9%
Create a Home Valuation Report for This Property
The Home Valuation Report is an in-depth analysis detailing your home's value as well as a comparison with similar homes in the area
Home Values in the Area
Average Home Value in this Area
Purchase History
| Date | Buyer | Sale Price | Title Company |
|---|---|---|---|
| Charlene Bai Revocable Trust | -- | Old Republic National Title In | |
| Bai Charlene | -- | Old Republic National Title | |
| Bai Charlene | -- | Old Republic National Title | |
| Bai Charlene | -- | Blueland Title | |
| Bai Charlene C | -- | Attorney | |
| Bai Charlene | $450,000 | Old Republic National Title | |
| Oak Bai | $505,000 | -- | |
| Kwon John | $340,000 | -- |
Source: Public Records
Mortgage History
| Date | Status | Borrower | Loan Amount |
|---|---|---|---|
| Previous Owner | Oak Bai | $454,500 | |
| Previous Owner | Kwon John | $272,000 |
Source: Public Records
Tax History
| Year | Tax Paid | Tax Assessment Tax Assessment Total Assessment is a certain percentage of the fair market value that is determined by local assessors to be the total taxable value of land and additions on the property. | Land | Improvement |
|---|---|---|---|---|
| 2025 | $11,262 | $558,800 | $340,000 | $218,800 |
| 2024 | $11,413 | $534,000 | $325,000 | $209,000 |
| 2023 | $11,303 | $519,000 | $315,000 | $204,000 |
| 2022 | $11,303 | $496,400 | $300,000 | $196,400 |
| 2021 | $10,486 | $446,400 | $255,000 | $191,400 |
| 2020 | $10,581 | $438,500 | $250,000 | $188,500 |
| 2019 | $10,300 | $438,500 | $250,000 | $188,500 |
| 2018 | $10,072 | $438,500 | $250,000 | $188,500 |
| 2017 | $10,033 | $438,500 | $250,000 | $188,500 |
| 2016 | $10,046 | $438,500 | $250,000 | $188,500 |
| 2015 | $9,844 | $438,500 | $250,000 | $188,500 |
| 2014 | $10,121 | $424,700 | $200,000 | $224,700 |
Source: Public Records
Map
Nearby Homes
- 1002 Whitney Ln
- 33 Homewood Ave
- 6 Cottage Place
- 77 Myrtle Ave
- 8 Crestwood Mews
- 260 W Allendale Ave
- 24 Summit Ave
- 5 Burning Hollow Rd
- 6 Burning Hollow Rd
- 31 Smith St
- 53 Lockwood Dr
- 19 Fox Run Rd Unit 19
- 10 E Allendale Rd
- 28 Zazzetti St
- 8 Masterson Ct
- 39 1 & 2 Smith
- 5 Everson Dr
- 4 Everson Dr
- 3 Everson Dr
- 2 Everson Dr
- 144 Carriage Ct
- 152 Carriage Ct
- 156 Carriage Ct
- 142 Carriage Ct
- 138 Carriage Ct
- 14 Trotters Ln
- 15 Trotters Ln Unit C0015
- 18 Trotters Ln
- 19 Trotters Ln
- 11 Trotters Ln
- 22 Trotters Ln
- 10 Trotters Ln
- 23 Trotters Ln
- 26 Trotters Ln
- 27 Trotters Ln
- 134 Carriage Ct
- 130 Carriage Ct
- 30 Trotters Ln Unit M30
- 31 Trotters Ln
- 126 Carriage Ct
Your Personal Tour Guide
Ask me questions while you tour the home.