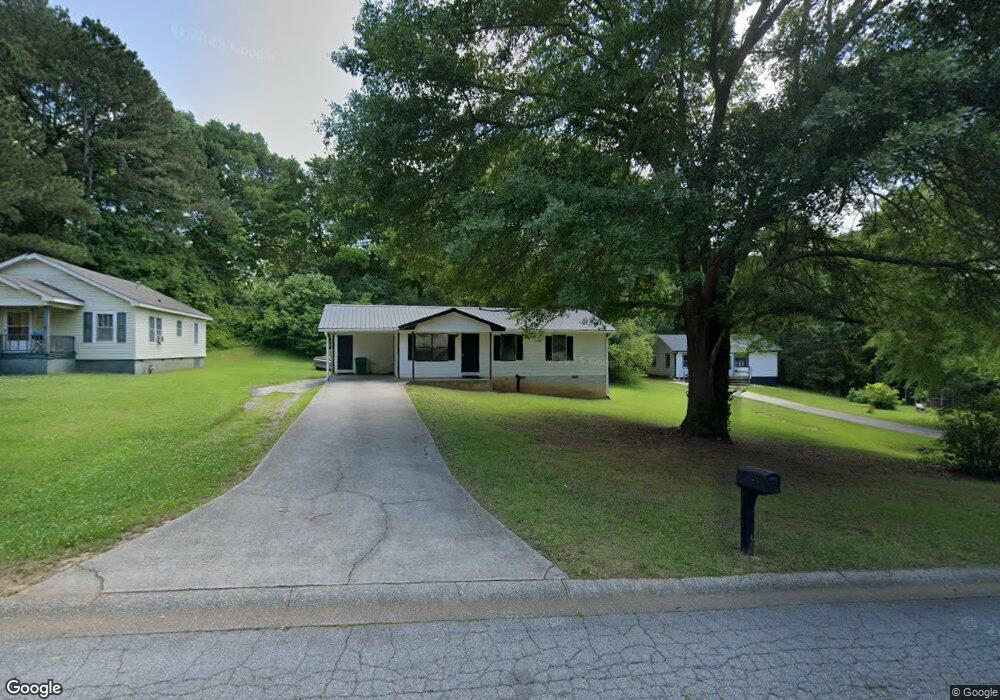
148 Carter St Carrollton, GA 30117
Estimated Value: $260,851 - $277,000
3
Beds
2
Baths
1,536
Sq Ft
$175/Sq Ft
Est. Value
About This Home
This home is located at 148 Carter St, Carrollton, GA 30117 and is currently estimated at $268,213, approximately $174 per square foot. 148 Carter St is a home located in Carroll County with nearby schools including Carrollton Elementary School, Carrollton Upper Elementary School, and Carrollton Middle School.
Ownership History
Date
Name
Owned For
Owner Type
Purchase Details
Closed on
Feb 4, 2016
Sold by
Hand Jessica M
Bought by
Hand John A and Hand Jessica M
Current Estimated Value
Purchase Details
Closed on
Oct 29, 2014
Sold by
Squires Jessica M
Bought by
Hand Jessica M
Purchase Details
Closed on
Jan 15, 2014
Sold by
Hand John Alfred
Bought by
Squires Jessica
Purchase Details
Closed on
Oct 17, 2011
Sold by
Frannie Mae
Bought by
Hand John
Purchase Details
Closed on
Feb 20, 2004
Sold by
Branch Banking & Trust Company
Bought by
Sanders Richard Omar
Purchase Details
Closed on
Aug 5, 2003
Sold by
Branch Banking & Trust Company
Bought by
Branch Banking & Trust Company
Purchase Details
Closed on
Nov 1, 1987
Sold by
Robinson W W
Bought by
Pope Loyd and Pope Wanda
Create a Home Valuation Report for This Property
The Home Valuation Report is an in-depth analysis detailing your home's value as well as a comparison with similar homes in the area
Home Values in the Area
Average Home Value in this Area
Purchase History
| Date | Buyer | Sale Price | Title Company |
|---|---|---|---|
| Hand John A | -- | -- | |
| Hand Jessica M | -- | -- | |
| Squires Jessica | -- | -- | |
| Hand John | $41,050 | -- | |
| Sanders Richard Omar | $66,700 | -- | |
| Branch Banking & Trust Company | -- | -- | |
| Branch Banking & Trust Company | $39,400 | -- | |
| Pope Loyd | $57,900 | -- |
Source: Public Records
Tax History Compared to Growth
Tax History
| Year | Tax Paid | Tax Assessment Tax Assessment Total Assessment is a certain percentage of the fair market value that is determined by local assessors to be the total taxable value of land and additions on the property. | Land | Improvement |
|---|---|---|---|---|
| 2024 | $2,429 | $83,623 | $7,000 | $76,623 |
| 2023 | $2,429 | $76,654 | $7,000 | $69,654 |
| 2022 | $2,021 | $62,892 | $7,000 | $55,892 |
| 2021 | $1,794 | $54,893 | $7,000 | $47,893 |
| 2020 | $1,265 | $49,299 | $7,000 | $42,299 |
| 2019 | $1,203 | $46,502 | $7,000 | $39,502 |
| 2018 | $1,125 | $42,839 | $7,000 | $35,839 |
| 2017 | $1,128 | $42,839 | $7,000 | $35,839 |
| 2016 | $1,129 | $42,839 | $7,000 | $35,839 |
| 2015 | $846 | $30,236 | $4,000 | $26,236 |
| 2014 | $737 | $30,236 | $4,000 | $26,236 |
Source: Public Records
Map
Nearby Homes
- 654 King St
- 109 7th St
- 250 Riversong Rd
- 250 Riversong Rd Unit 55
- 149 River Dr
- 149 River Dr Unit 42
- TRACT1-7 Us Highway 27
- 405 N Park St
- 102 Avalon Dr
- 108 Springwood Dr
- 160 Watson St
- 109 S Park St
- 109 Chalfont Cir
- 0 Ward St Unit 10390499
- 205 Johnson Ave Unit 231
- 110 Town Walk Ln
- 103 W Chandler St
- 219 Broad St
- 301 C4 Bradley St
- 301 Bradley St
- 148 Carter St
- 148 Carter St
- 148 Carter St
- 148 Carter St
- 148 Carter St
- 148 Carter St
- 148 Carter St
- 148 Carter St
- 150 Carter St
- 144 Carter St
- 321 Willie North St
- 152 Carter St
- 319 Willie North St
- 142 Carter St
- 147 Carter St
- 145 Carter St
- 203 Beall St
- 143 Carter St
- 200 Robert Hendrix Dr
- 0 Willie St N Unit 7161093