148 Chestnut St Unit 2 Everett, MA 02149
Glendale NeighborhoodEstimated Value: $742,995 - $944,000
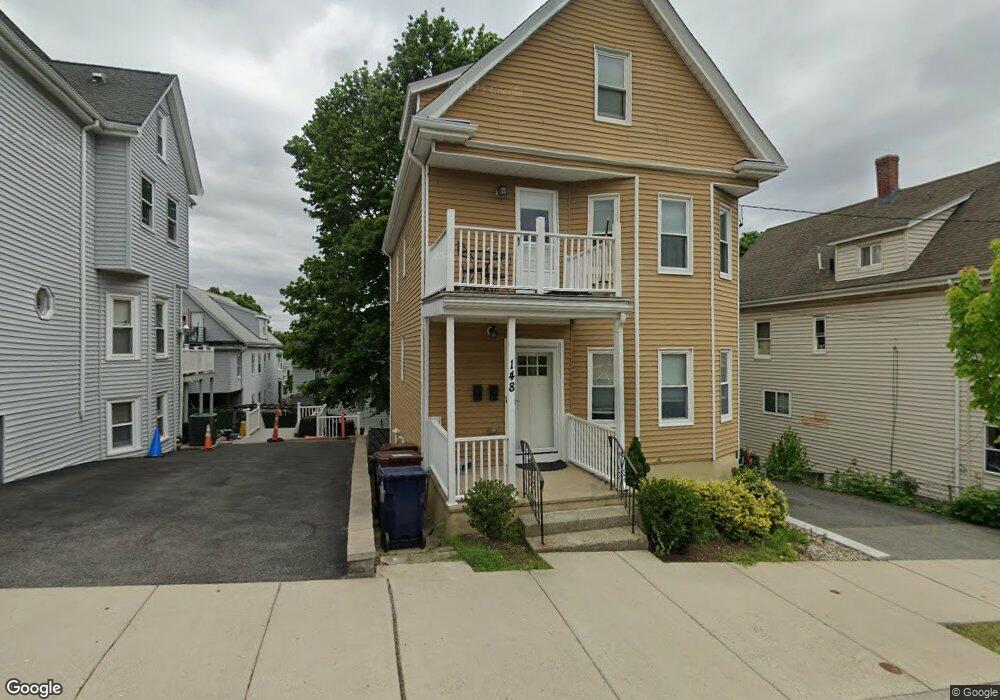
About This Home
This home is located at 148 Chestnut St Unit 2, Everett, MA 02149 and is currently estimated at $869,749, approximately $579 per square foot. 148 Chestnut St Unit 2 is a home located in Middlesex County with nearby schools including Everett High School and Pioneer Charter School of Science.
Ownership History
We collect this data history from publicly available records. To have your information removed, we recommend requesting removal directly through your county’s website.
Purchase Details
Home Financials for this Owner
Home Financials are based on the most recent Mortgage that was taken out on this home.Purchase Details
Purchase Details
Home Values in the Area
Average Home Value in this Area
Purchase History
We collect this data history from publicly available records. To have your information removed, we recommend requesting removal directly through your county’s website.
| Date | Buyer | Sale Price | Title Company |
|---|---|---|---|
| $700,000 | None Available | ||
| $460,000 | -- | ||
| -- | -- |
Mortgage History
We collect this data history from publicly available records. To have your information removed, we recommend requesting removal directly through your county’s website.
| Date | Status | Borrower | Loan Amount |
|---|---|---|---|
| Open | $676,637 |
Tax History
We collect this data history from publicly available records. To have your information removed, we recommend requesting removal directly through your county’s website.
| Year | Tax Paid | Tax Assessment Tax Assessment Total Assessment is a certain percentage of the fair market value that is determined by local assessors to be the total taxable value of land and additions on the property. | Land | Improvement |
|---|---|---|---|---|
| 2025 | $8,401 | $737,600 | $253,000 | $484,600 |
| 2024 | $7,730 | $674,500 | $224,900 | $449,600 |
| 2023 | $7,463 | $633,500 | $206,200 | $427,300 |
| 2022 | $6,163 | $594,900 | $196,800 | $398,100 |
| 2021 | $4,736 | $479,800 | $176,200 | $303,600 |
| 2020 | $4,994 | $469,400 | $176,200 | $293,200 |
| 2019 | $5,297 | $427,900 | $167,800 | $260,100 |
| 2018 | $5,187 | $376,400 | $146,200 | $230,200 |
| 2017 | $4,628 | $320,500 | $112,500 | $208,000 |
| 2016 | $4,316 | $298,700 | $112,500 | $186,200 |
| 2015 | $4,092 | $280,100 | $105,700 | $174,400 |
Map
- 43-45 Shirley St
- 20 Derne St
- 110 Ferry St
- 148 Florence St
- 20 Raymond St
- 6 Hampshire St
- 8 Parker St Unit 5
- 30 Waverly Ave
- 30 Clarence St
- 2 Rosedale Ave
- 40 Baker Rd
- 58 Union St
- 159 Jefferson Ave
- 15 Marie Ave
- 8 Walnut St Unit 2
- 8 Walnut St Unit 28
- 94-96 Francis St
- 162 Vine St
- 83 Dartmouth St
- 24-26 Edith Ave
Ask me questions while you tour the home.