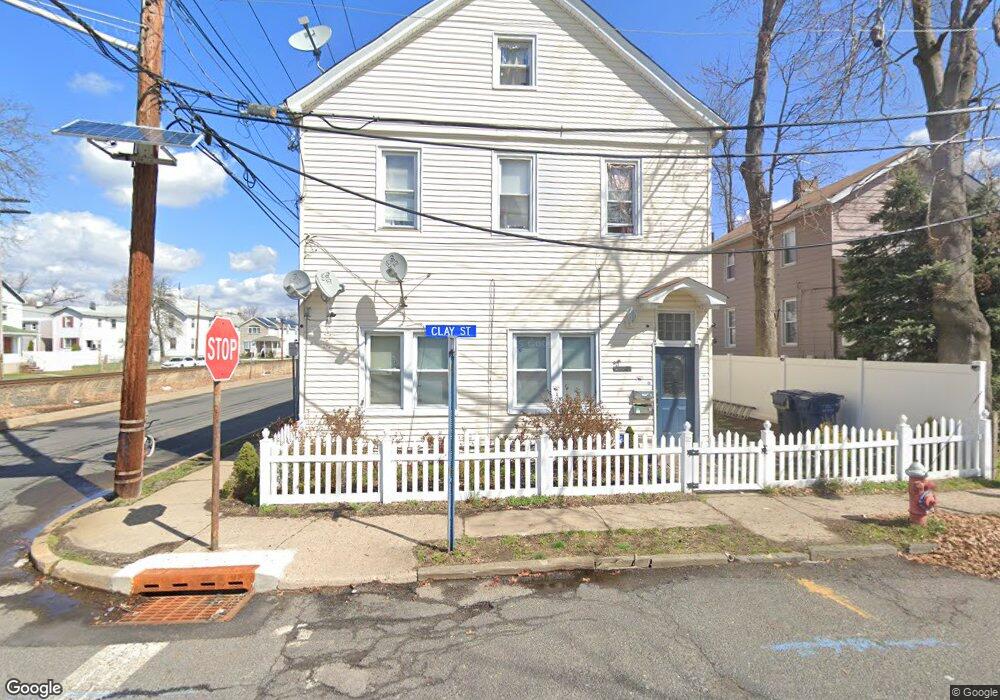
148 Clay St Hackensack, NJ 07601
Estimated Value: $574,000 - $700,068
Studio
--
Bath
2,234
Sq Ft
$289/Sq Ft
Est. Value
About This Home
This home is located at 148 Clay St, Hackensack, NJ 07601 and is currently estimated at $645,767, approximately $289 per square foot. 148 Clay St is a home located in Bergen County with nearby schools including Hackensack High School and Bergen County Christian Academy.
Ownership History
Date
Name
Owned For
Owner Type
Purchase Details
Closed on
Oct 26, 2016
Sold by
Drummond Ann Marie and Estate Of Martin Drummond
Bought by
Lee Olacia
Current Estimated Value
Home Financials for this Owner
Home Financials are based on the most recent Mortgage that was taken out on this home.
Original Mortgage
$324,022
Outstanding Balance
$258,729
Interest Rate
3.25%
Mortgage Type
FHA
Estimated Equity
$387,038
Purchase Details
Closed on
Jun 28, 2007
Sold by
Horwhit Investment Group Llc
Bought by
Drummond Martin
Purchase Details
Closed on
Jun 1, 2007
Sold by
Dock Russell and Russell Catherine
Bought by
Horwhit Investment Group Llc
Create a Home Valuation Report for This Property
The Home Valuation Report is an in-depth analysis detailing your home's value as well as a comparison with similar homes in the area
Home Values in the Area
Average Home Value in this Area
Purchase History
| Date | Buyer | Sale Price | Title Company |
|---|---|---|---|
| Lee Olacia | $330,000 | None Available | |
| Drummond Martin | $285,000 | -- | |
| Horwhit Investment Group Llc | $190,000 | -- |
Source: Public Records
Mortgage History
| Date | Status | Borrower | Loan Amount |
|---|---|---|---|
| Open | Lee Olacia | $324,022 |
Source: Public Records
Tax History
| Year | Tax Paid | Tax Assessment Tax Assessment Total Assessment is a certain percentage of the fair market value that is determined by local assessors to be the total taxable value of land and additions on the property. | Land | Improvement |
|---|---|---|---|---|
| 2025 | $12,664 | $414,400 | $142,300 | $272,100 |
| 2024 | $11,931 | $414,400 | $142,300 | $272,100 |
| 2023 | $11,000 | $414,400 | $142,300 | $272,100 |
| 2022 | $11,250 | $401,500 | $131,100 | $270,400 |
| 2021 | $10,189 | $321,000 | $106,400 | $214,600 |
| 2020 | $10,622 | $321,000 | $106,400 | $214,600 |
| 2019 | $10,615 | $316,200 | $104,900 | $211,300 |
| 2018 | $11,157 | $326,900 | $102,400 | $224,500 |
| 2017 | $10,989 | $321,800 | $100,900 | $220,900 |
| 2016 | $10,411 | $308,200 | $90,900 | $217,300 |
| 2015 | $9,268 | $264,800 | $103,600 | $161,200 |
| 2014 | $8,797 | $264,800 | $103,600 | $161,200 |
Source: Public Records
Map
Nearby Homes
- 168 Clay St Unit 70
- 363 Park St
- 298 3rd St
- 433 Park St
- 252 Berry St
- 5 Linden St Unit 3C
- 72 Lawrence St
- 160 Overlook Ave Unit 16C
- 160 Overlook Ave Unit 4C
- 285 Berry St
- 150 Overlook Ave Unit 10H
- 150 Overlook Ave Unit 7F
- 150 Overlook Ave Unit 12E
- 280 Prospect Ave Unit 9H
- 280 Prospect Ave Unit 11H
- 280 Prospect Ave Unit 5D
- 280 Prospect Ave Unit 6J
- 280 Prospect Ave Unit 3N
- 395 2nd St
- 326 Prospect Ave Unit 8E
Your Personal Tour Guide
Ask me questions while you tour the home.