148 E Rogers Rd Longmont, CO 80501
Estimated Value: $402,903
About This Home
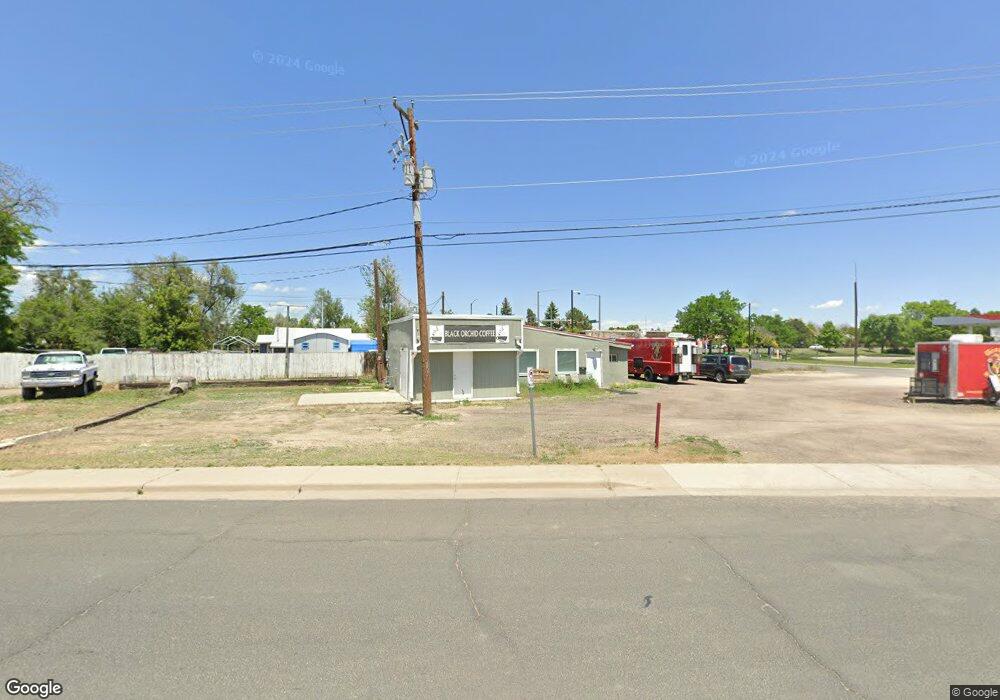
This home is located at 148 E Rogers Rd, Longmont, CO 80501 and is currently estimated at $402,903, approximately $457 per square foot. 148 E Rogers Rd is a home located in Boulder County with nearby schools including Columbine Elementary School, Trail Ridge Middle School, and Skyline High School.
Ownership History
We collect this data history from publicly available records. To have your information removed, we recommend requesting removal directly through your county’s website.
Purchase Details
Purchase Details
Purchase Details
Purchase Details
Purchase Details
Purchase Details
Purchase Details
Purchase Details
Purchase Details
Purchase History
We collect this data history from publicly available records. To have your information removed, we recommend requesting removal directly through your county’s website.
| Date | Buyer | Sale Price | Title Company |
|---|---|---|---|
| $440,000 | None Listed On Document | ||
| -- | None Listed On Document | ||
| -- | None Listed On Document | ||
| $105,000 | None Available | ||
| $50,000 | -- | ||
| -- | -- | ||
| $30,000 | -- | ||
| -- | -- | ||
| $5,000 | -- | ||
| -- | -- |
Tax History
We collect this data history from publicly available records. To have your information removed, we recommend requesting removal directly through your county’s website.
| Year | Tax Paid | Tax Assessment Tax Assessment Total Assessment is a certain percentage of the fair market value that is determined by local assessors to be the total taxable value of land and additions on the property. | Land | Improvement |
|---|---|---|---|---|
| 2026 | $10,698 | $101,500 | $91,350 | $10,150 |
| 2025 | $10,698 | $101,500 | $91,350 | $10,150 |
| 2024 | $11,580 | $109,620 | $98,658 | $10,962 |
| 2023 | $11,422 | $121,058 | $116,485 | $12,943 |
| 2022 | $5,587 | $56,463 | $26,680 | $29,783 |
| 2021 | $5,501 | $56,463 | $26,680 | $29,783 |
| 2020 | $5,155 | $53,070 | $26,680 | $26,390 |
| 2019 | $5,074 | $53,070 | $26,680 | $26,390 |
| 2018 | $3,795 | $39,951 | $17,896 | $22,055 |
| 2017 | $3,743 | $39,951 | $17,896 | $22,055 |
| 2016 | $2,728 | $28,536 | $5,394 | $23,142 |
| 2015 | $2,599 | $17,980 | $17,719 | $261 |
| 2014 | $1,679 | $17,980 | $17,719 | $261 |
Map
- 311 Wadsworth Ct
- 247 Wadsworth Cir
- 36 Reed Place
- 433 Sunnyside Ln
- 405 Elliott St
- 244 Sorento Place
- 12 Marshall Place
- 531 Alpine St
- 127 E Saint Clair Ave
- 443 Baker St
- 422 Atwood St
- 348 Collyer St Unit 208
- 613 Martin St
- 225 E 8th Ave Unit F6
- 225 E 8th Ave Unit F2
- 716 Goss Dr
- 707 Hilltop St
- 400 Emery St Unit 103
- 757 Lashley St
- 218 E 8th Ave
- 144 E Rogers Rd
- 132 E Rogers Rd
- 128 E Rogers Rd
- 124 E Rogers Rd
- 120 E Rogers Rd
- 116 E Rogers Rd
- 305 Lashley St
- 79 E 2nd Ave
- 108 E Rogers Rd
- 150 Rothrock Place Unit 13C
- 150 Rothrock Place Unit 9C
- 150 Rothrock Place
- 138 Rothrock Place
- 136 Rothrock Place
- 311 Lashley St Unit 313
- 49 E 2nd Ave
- 104 E Rogers Rd
- 124 Rothrock Place
- 317 Lashley St
- 131 Reed Place
Ask me questions while you tour the home.