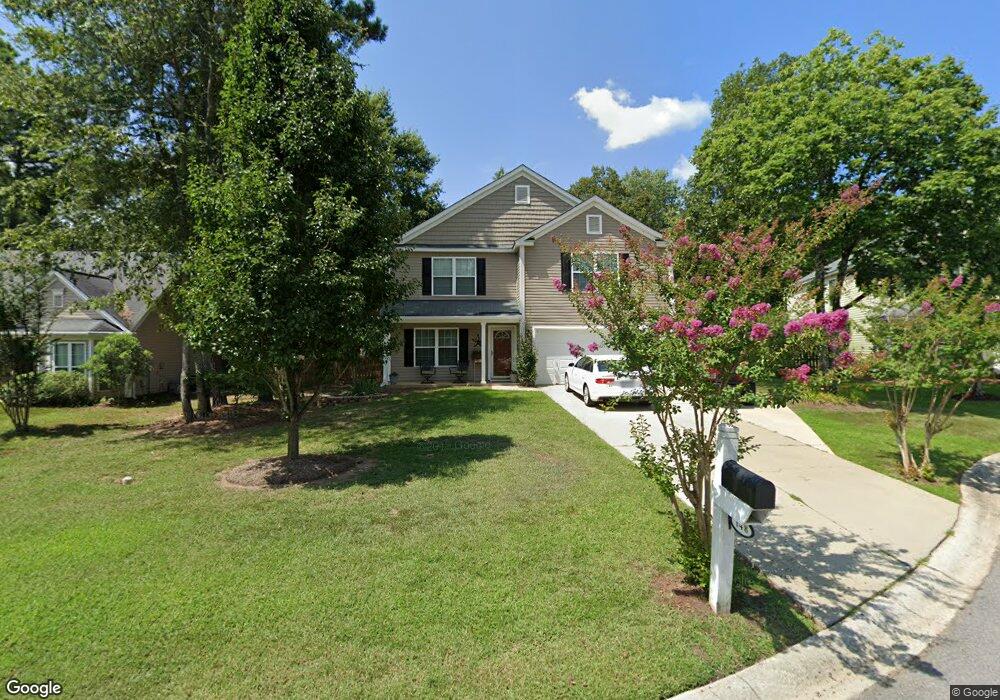
148 Eagle Pointe Dr Chapin, SC 29036
Estimated Value: $258,000 - $288,000
3
Beds
3
Baths
2,095
Sq Ft
$131/Sq Ft
Est. Value
About This Home
This home is located at 148 Eagle Pointe Dr, Chapin, SC 29036 and is currently estimated at $275,306, approximately $131 per square foot. 148 Eagle Pointe Dr is a home located in Lexington County with nearby schools including Chapin Elementary School, Chapin Intermediate, and Chapin High School.
Ownership History
Date
Name
Owned For
Owner Type
Purchase Details
Closed on
Feb 6, 2017
Sold by
Archstone Properties Llc
Bought by
White John Scott and White Christina Lynn
Current Estimated Value
Home Financials for this Owner
Home Financials are based on the most recent Mortgage that was taken out on this home.
Original Mortgage
$152,648
Outstanding Balance
$127,433
Interest Rate
4.5%
Mortgage Type
FHA
Estimated Equity
$147,873
Purchase Details
Closed on
Oct 31, 2016
Sold by
Spence James O
Bought by
Wells Fargo Bank Na and Eagle Pointee Homeowners Assosiation Inc
Purchase Details
Closed on
Jun 24, 2011
Sold by
Dotterer Travis H and Dotterer Kimberly L
Bought by
Harris Sean M
Home Financials for this Owner
Home Financials are based on the most recent Mortgage that was taken out on this home.
Original Mortgage
$141,324
Interest Rate
4.75%
Mortgage Type
FHA
Purchase Details
Closed on
Dec 21, 2007
Sold by
Rivers Jeffrey B and Rivers Allison T
Bought by
Dotterer Travis H and Dotterer Kimberly L
Create a Home Valuation Report for This Property
The Home Valuation Report is an in-depth analysis detailing your home's value as well as a comparison with similar homes in the area
Home Values in the Area
Average Home Value in this Area
Purchase History
| Date | Buyer | Sale Price | Title Company |
|---|---|---|---|
| White John Scott | -- | None Available | |
| Wells Fargo Bank Na | $111,400 | Attorney | |
| Harris Sean M | $145,000 | -- | |
| Dotterer Travis H | $144,000 | None Available |
Source: Public Records
Mortgage History
| Date | Status | Borrower | Loan Amount |
|---|---|---|---|
| Open | White John Scott | $152,648 | |
| Previous Owner | Harris Sean M | $141,324 |
Source: Public Records
Tax History
| Year | Tax Paid | Tax Assessment Tax Assessment Total Assessment is a certain percentage of the fair market value that is determined by local assessors to be the total taxable value of land and additions on the property. | Land | Improvement |
|---|---|---|---|---|
| 2024 | $1,043 | $6,332 | $1,000 | $5,332 |
| 2023 | $968 | $6,332 | $1,000 | $5,332 |
| 2020 | $1,023 | $6,332 | $1,000 | $5,332 |
| 2019 | $1,023 | $6,219 | $1,000 | $5,219 |
| 2018 | $900 | $6,219 | $1,000 | $5,219 |
| 2017 | $752 | $5,325 | $1,000 | $4,325 |
| 2016 | $771 | $5,325 | $1,000 | $4,325 |
| 2014 | $834 | $5,794 | $1,000 | $4,794 |
| 2013 | -- | $8,690 | $1,500 | $7,190 |
Source: Public Records
Map
Nearby Homes
- 392 Eagle Pointe Dr
- 814 Dutchmaster Dr
- 160 State Road S-32-716
- 147 State Road S-32-716
- 368 Frick Ct
- 192 Palm St
- 134 Walkbridge Way
- 153 Rushton Dr
- 1533 Saugus Ct
- 312 Throne Ct
- 720 Topline St
- 1661 Old Lexington Hwy
- 366 Gallery Cliff Dr
- 512 Stucks Point Dr
- 339 Newberg Rd
- 512 Old Bush River Rd
- 228 Bickley View Ct
- 0 Dreher Island Rd Unit 21647709
- 0 Dreher Island Rd Unit 587193
- 171 Elm Creek Dr
- 144 Eagle Pointe Dr
- 156 Eagle Pointe Dr
- 140 Eagle Pointe Dr
- 151 Eagle Pointe Dr
- 136 Eagle Pointe Dr
- 160 Eagle Pointe Dr
- 155 Eagle Pointe Dr
- 132 Eagle Pointe Dr
- 101 Wingspan Way
- 164 Eagle Pointe Dr
- 129 Eagle Pointe Dr
- 128 Eagle Pointe Dr
- 105 Wingspan Way
- 168 Eagle Pointe Dr
- 125 Eagle Pointe Dr
- 124 Eagle Pointe Dr
- 109 Wingspan Way
- 172 Eagle Pointe Dr
- 121 Eagle Pointe Dr
- 120 Eagle Pointe Dr
Your Personal Tour Guide
Ask me questions while you tour the home.