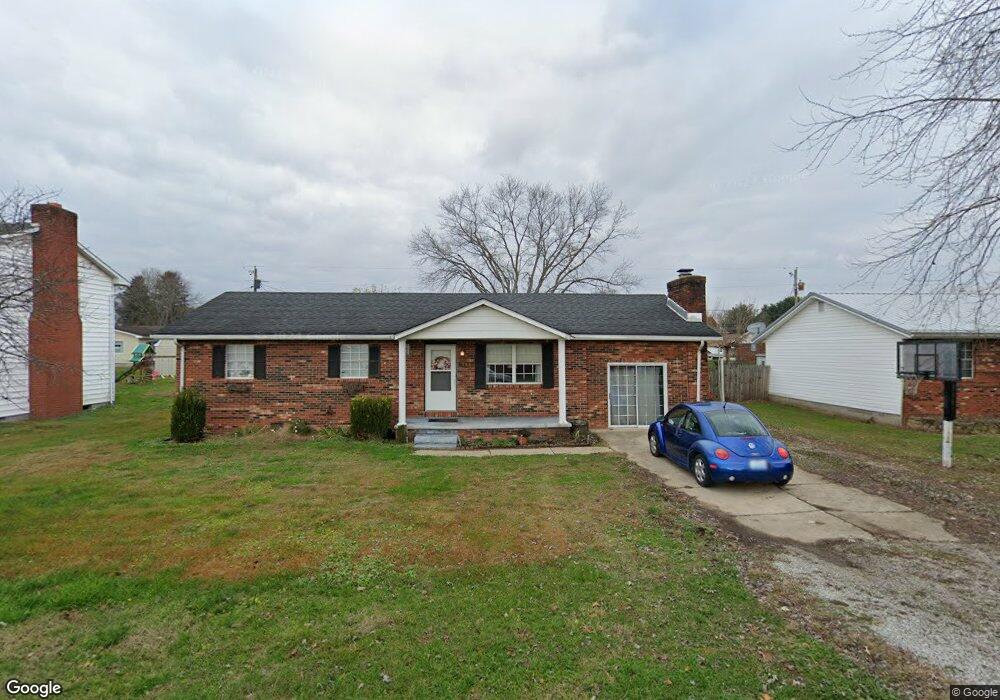
148 Eighth St South Shore, KY 41175
Estimated Value: $92,000 - $131,000
3
Beds
1
Bath
1,430
Sq Ft
$84/Sq Ft
Est. Value
About This Home
This home is located at 148 Eighth St, South Shore, KY 41175 and is currently estimated at $120,347, approximately $84 per square foot. 148 Eighth St is a home located in Greenup County with nearby schools including Greenup County High School.
Ownership History
Date
Name
Owned For
Owner Type
Purchase Details
Closed on
Nov 6, 2013
Sold by
Federal Housing Commissioner
Bought by
Kennard Kenneth and Kennard Charmine
Current Estimated Value
Home Financials for this Owner
Home Financials are based on the most recent Mortgage that was taken out on this home.
Original Mortgage
$33,670
Outstanding Balance
$17,099
Interest Rate
4.26%
Mortgage Type
New Conventional
Estimated Equity
$103,248
Purchase Details
Closed on
May 23, 2013
Sold by
Midfirst Bank
Bought by
Midfirst Bank and Secretary Of Dept Of Housing And Urban D
Create a Home Valuation Report for This Property
The Home Valuation Report is an in-depth analysis detailing your home's value as well as a comparison with similar homes in the area
Home Values in the Area
Average Home Value in this Area
Purchase History
| Date | Buyer | Sale Price | Title Company |
|---|---|---|---|
| Kennard Kenneth | $48,100 | -- | |
| Midfirst Bank | $71,586 | -- |
Source: Public Records
Mortgage History
| Date | Status | Borrower | Loan Amount |
|---|---|---|---|
| Open | Kennard Kenneth | $33,670 |
Source: Public Records
Tax History Compared to Growth
Tax History
| Year | Tax Paid | Tax Assessment Tax Assessment Total Assessment is a certain percentage of the fair market value that is determined by local assessors to be the total taxable value of land and additions on the property. | Land | Improvement |
|---|---|---|---|---|
| 2025 | $1,106 | $64,900 | $10,000 | $54,900 |
| 2024 | $1,104 | $64,900 | $10,000 | $54,900 |
| 2023 | $1,042 | $64,900 | $10,000 | $54,900 |
| 2022 | $1,010 | $64,900 | $10,000 | $54,900 |
| 2021 | $1,005 | $64,900 | $10,000 | $54,900 |
| 2020 | $989 | $64,900 | $10,000 | $54,900 |
| 2019 | $998 | $64,900 | $10,000 | $54,900 |
| 2018 | $1,023 | $64,900 | $10,000 | $54,900 |
| 2017 | $984 | $64,900 | $10,000 | $54,900 |
| 2016 | $984 | $64,900 | $10,000 | $54,900 |
| 2015 | $977 | $64,900 | $10,000 | $54,900 |
| 2014 | $746 | $50,000 | $10,000 | $40,000 |
| 2011 | -- | $64,900 | $10,000 | $54,900 |
Source: Public Records
Map
Nearby Homes