Estimated Value: $726,285 - $919,000
3
Beds
2
Baths
1,856
Sq Ft
$436/Sq Ft
Est. Value
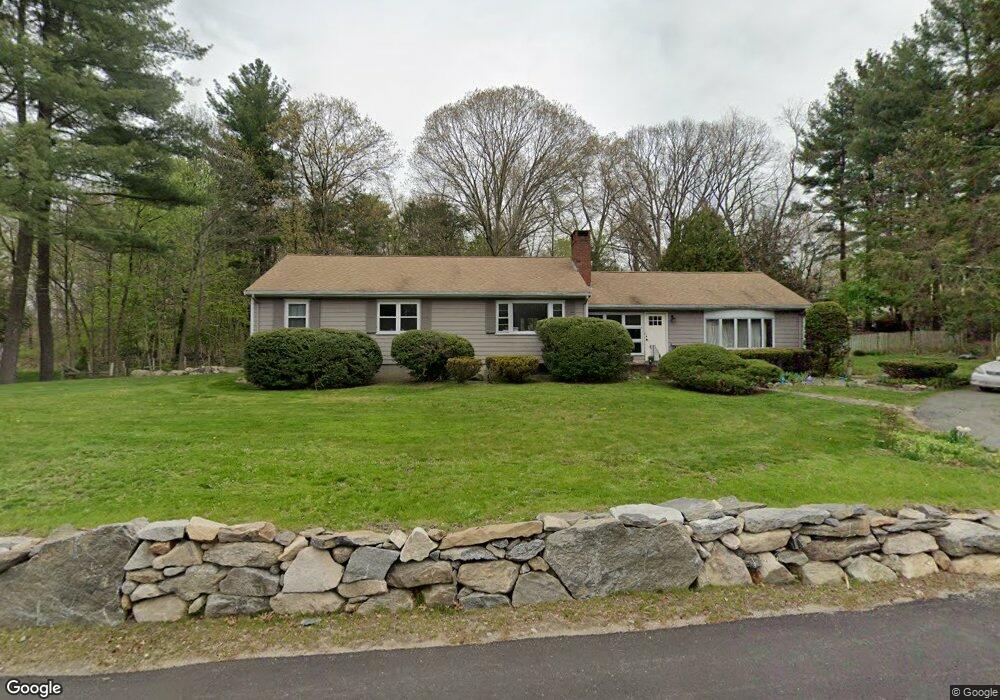
About This Home
This home is located at 148 High St, Acton, MA 01720 and is currently estimated at $809,071, approximately $435 per square foot. 148 High St is a home located in Middlesex County with nearby schools including Acton-Boxborough Regional High School, Maynard Knowledge Beginnings, and The Imago School.
Ownership History
Date
Name
Owned For
Owner Type
Purchase Details
Closed on
May 27, 1993
Sold by
Nelson Stanley E and Nelson Cynthia A
Bought by
Sheehan William J and Cardillo Nancy J
Current Estimated Value
Home Financials for this Owner
Home Financials are based on the most recent Mortgage that was taken out on this home.
Original Mortgage
$164,000
Interest Rate
7.41%
Mortgage Type
Purchase Money Mortgage
Create a Home Valuation Report for This Property
The Home Valuation Report is an in-depth analysis detailing your home's value as well as a comparison with similar homes in the area
Home Values in the Area
Average Home Value in this Area
Purchase History
| Date | Buyer | Sale Price | Title Company |
|---|---|---|---|
| Sheehan William J | $205,000 | -- |
Source: Public Records
Mortgage History
| Date | Status | Borrower | Loan Amount |
|---|---|---|---|
| Open | Sheehan William J | $200,000 | |
| Closed | Sheehan William J | $164,000 |
Source: Public Records
Tax History
| Year | Tax Paid | Tax Assessment Tax Assessment Total Assessment is a certain percentage of the fair market value that is determined by local assessors to be the total taxable value of land and additions on the property. | Land | Improvement |
|---|---|---|---|---|
| 2025 | $10,657 | $621,400 | $316,700 | $304,700 |
| 2024 | $10,129 | $607,600 | $316,700 | $290,900 |
| 2023 | $9,670 | $550,700 | $287,600 | $263,100 |
| 2022 | $9,624 | $494,800 | $250,200 | $244,600 |
| 2021 | $9,332 | $461,300 | $231,600 | $229,700 |
| 2020 | $8,754 | $455,000 | $231,600 | $223,400 |
| 2019 | $8,302 | $428,600 | $231,600 | $197,000 |
| 2018 | $7,764 | $400,600 | $231,600 | $169,000 |
| 2017 | $7,635 | $400,600 | $231,600 | $169,000 |
| 2016 | $7,225 | $375,700 | $231,600 | $144,100 |
| 2015 | $7,268 | $381,500 | $231,600 | $149,900 |
| 2014 | $7,296 | $375,100 | $231,600 | $143,500 |
Source: Public Records
Map
Nearby Homes
- 30 Brewster Ln
- 1 Drummer Rd Unit A5
- 128 Parker St Unit 3B
- 63 Conant St
- 40 High St
- 31 Drummer Rd Unit 31
- 1 Vanderbelt Rd
- 70 River St
- 7 Hillcrest Dr
- 36 Brown St
- 129 Main St Unit 129
- 131 Main St
- 70 Powder Mill Rd
- 12 Brown St
- 68 Powder Mill Rd
- 66 Powder Mill Rd
- 25 Nylander Way
- 23 Deer Path Unit 5
- 96 Forest Ridge Rd Unit 96
- 184 Main St Unit 3
Your Personal Tour Guide
Ask me questions while you tour the home.